Fig. 4.
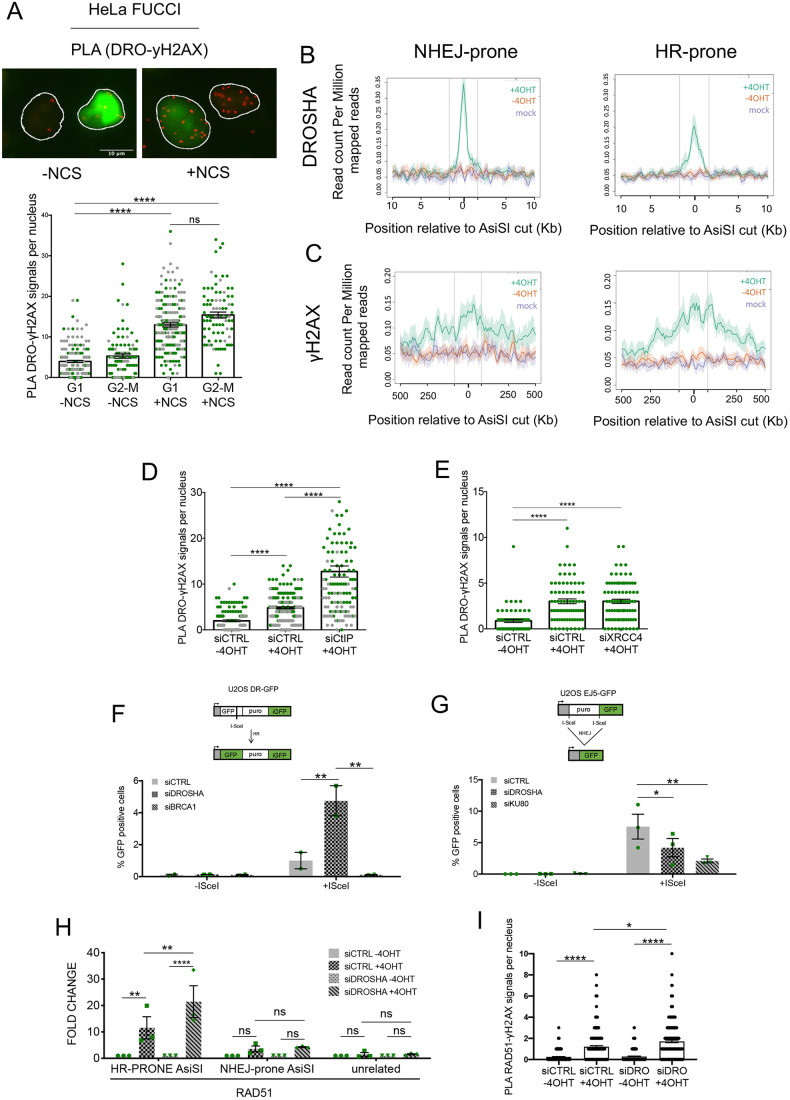
DROSHA recruitment to DSBs occurs throughout the cell cycle and preferentially at NHEJ-prone DSBs. (A) The FUCCI (fluorescence ubiquitination cell cycle indicator) cell cycle sensor consists of a fluorescent protein-based system that employs both a red (RFP) and a green (GFP) fluorescent protein fused to different regulators of the cell cycle: CDT1 and geminin. During the cell cycle, these two proteins display temporal regulation that results in the biphasic cycling their levels during the cell cycle. In the G1 phase of the cell cycle only CDT1 tagged with RFP is present and appears as red fluorescence within the nuclei. In the S, G2 and M phases only geminin tagged with GFP remains, resulting in cells with green fluorescent nuclei. Representative images of PLA signal (red puncta) of γH2AX–DROSHA proximity in NCS treated (12 ng/ml) and untreated HeLa FUCCI cells. Nuclei are outlined in white. The scatter plot shows the number of PLA signals for cells in the indicated phases of the cell cycle, as measured using CellProfiler automated software. Data are presented as mean±s.e.m. (250 cells, n=2). ****P≤0.0001; ns, not significant (one-way ANOVA with Tukey's multiple comparison test). (B,C) Mean±s.e.m. DROSHA (B) or γH2AX (C) ChIP-seq signals of NHEJ-prone (left) or HR-prone (right) AsiSI sites, over 1 Mb or 20 kb windows, respectively, and centered at the AsiSI site, are shown for cut (+4OHT, green), uncut (−4OHT, red) or mock (magenta) samples. All the AsiSI sites assayed are included in the most cut AsiSI sites (Iannelli et al., 2017). Vertical lines indicate the boundaries of the region used to center all the top 50 AsiSI sites. (D) The scatter plot represents the number of γH2AX–DROSHA PLA signals measured using CellProfiler automated software in cut (+4OHT) and uncut (−4OHT) DIvA cells mock treated with non-targeting siRNA (siCTRL) and in cut DIvA cells knocked down for CtIP (siCtIP). Data are presented as mean±s.e.m. (150 cells, n=2). ****P≤0.0001 (one-way ANOVA with Tukey's multiple comparison test). (E) The scatter plot represents the number of γH2AX–DROSHA PLA signals measured using CellProfiler automated software in cut (+4OHT) and uncut (−4OHT) siCTRL-treated DIvA cells and in cut DIvA cells knocked down for XRCC4 (siXRCC4). Data are presented as mean±s.e.m. (90 cells, n=1). ****P≤0.0001 (one-way ANOVA with Tukey's multiple comparison test). (F) Schematic of the DR-GFP reporter used to monitor HR in U2OS cells. Puro, puromycin resistance gene; iGFP, internal GFP repeat. U2OS DR-GFP cells were transfected with control siRNA (siCTRL), siRNA against DROSHA (siDROSHA) or siRNA against BRCA1 (siBRCA1). Cells were induced with doxycycline (5 μg/ml; +ISceI) or mock treated with DMSO (–ISceI) 48 h before analysis. GFP-positive cells were analysed by flow cytometry to score the HR repair efficiency. The bar plot shows mean±s.e.m. percentage of GFP-positive cells from two independent experiments. **P≤0.01 (two-way ANOVA with Šidák correction). (G) Schematic of the EJ5-GFP reporter used to monitor NHEJ in U2OS cells. U2OS EJ5 cells were transfected with control siRNA (siCTRL), siRNA against DROSHA (siDROSHA) or siRNA against KU80 (siKU80). Cells were transfected with ISceI (+ISceI) or empty vector plasmids (−ISceI) 48 h before analysis. GFP-positive cells were analysed by flow cytometry to score the NHEJ repair efficiency. The bar plot shows the mean±s.e.m. percentage of GFP-positive cells from three independent experiments. *P≤0.05; **P≤0.01 (two-way ANOVA with Šidák correction). (H) The bar plot shows the fold change in ChIP enrichment, relative to the uncut sample (−4OHT), of RAD51 as detected by ChIP-qPCR in cut (+4OHT) and uncut (−4OHT) DIvA cells knocked down for DROSHA (siDROSHA) or mock treated with non-targeting siRNA (siCTRL), with primers matching an NHEJ-prone ASiSI site, an HR-prone AsiSI site or an unrelated genomic region far from any annotated AsiSI sites. Data are presented as mean±s.e.m. of three independent experiments. **P≤0.01; ****P≤0.0001; ns, not significant (two-way ANOVA with Tukey's multiple comparison test). (I) The scatter plot represents the number of RAD51–γH2AX PLA signals measured using CellProfiler automated software in cut (+4OHT) and uncut (−4OHT) DIvA cells either knocked down for DROSHA (siDRO) or mock treated with non-targeting siRNA (siCTRL). Data are presented as the mean±s.e.m. (250 cells, n=3). *P≤0.05; ****P≤0.0001 (one-way ANOVA with Tukey's multiple comparison test).

