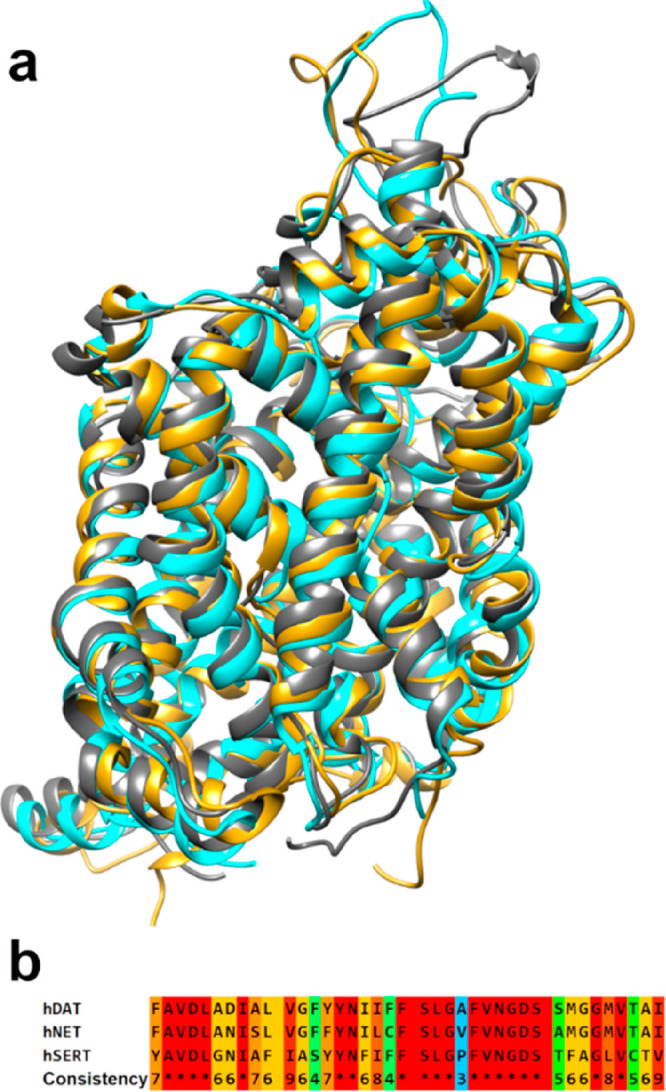
Figure 2.

a) Superimposition of hDAT (cyan), hNET (gold), and hSERT (gray) models and b) sequence alignment of the binding site residues: in red are highlighted the identical regions, while conservative substitutions are highlighted in scale from cyan to orange.
