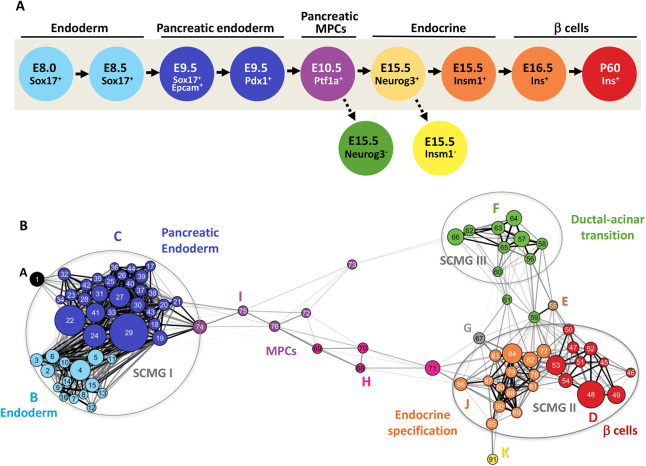
Fig. 1.
Developmentally oriented gene co-expression network for β-cells. (A) A developmental scheme outlining 11 populations representing different stages of β-cell development profiled by RNA-Seq. Nine murine cell populations along the β-cell lineage and two additional mutant populations were profiled. Each profiled cell population has been shown in genetically altered mice to reflect a defined progenitor cell population that precedes the formation of mature β-cells, the populations are: gut tube endoderm (Sox17+/− at E8.5), posterior foregut endoderm (Pdx1+/− at E9.5), pancreatic multipotent progenitor cells (MPCs) (Ptf1a+/− at E10.5), endocrine progenitor cells (Neurog3+/− and Insm1+/− at E15.5), nascent β-cells (Ins+ at E16.5), and adult β-cells (Ins+ at P60). Also profiled were two mutant conditions for endocrine progenitor cells (Neurog3−/− and Insm1−/− at E15.5). (B) A meta-network view of GCN constructed by applying iterative WGCNA analysis on the obtained developmental RNA-Seq profiles. Each node in the meta-network represents a module of highly co-expressed genes; module numbers are indicated inside the node; node sizes are proportional to the number of genes in the module. Node color represents meta-module memberships and is coordinated with colors of developmental stages (as in A) it represents. The meta-network is defined by correlations between module eigengenes and partitions modules into three distinct strongly connected module groups (SCMGs). Edge lengths are inversely proportional to the topological overlap between modules; two modules with a high degree of topological overlap are strongly connected to the same group of modules. The strongest connections (topological overlap>0.45) are further highlighted by heavy black lines. A high-resolution version of this image is provided in Fig. S4, as is an interactive Cytoscape file for the entire network as well as individual meta-modules via https://markmagnuson.github.io/BetaCell-GCN/.

