Fig. 8.
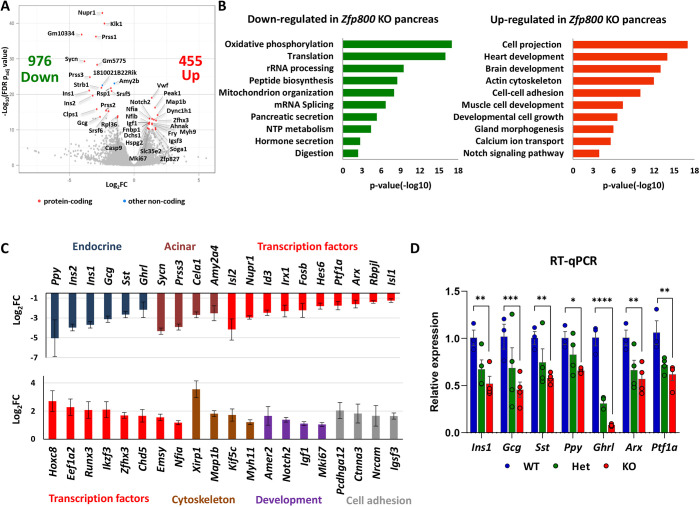
RNA-Seq analysis of pancreatic tissues from Zfp800 knockout mice. (A) Volcano plot showing differentially expressed genes (log2FC over P-value) in Zfp800 KO versus WT pancreata from E18.5 embryos. The top ten differentially expressed genes (based on Padj value) are indicated by names and total numbers of downregulated (Down) and upregulated (Up) genes are provided (log2FC<−1 or >1, Padj<0.05). (B) Functional enrichment analysis of downregulated and upregulated genes. Select top enriched pathways are shown. (C) Differential expression of select top downregulated (top graph) and upregulated (bottom graph) genes. Colors indicate gene functional associations. Log2FC: log2 fold change Zfp800 KO versus WT (Padj<0.05), error bars represent s.e.m. (Log2FC) determined by DEseq. (D) RT-qPCR analysis of mRNA expression for select pancreatic genes in pancreatic RNA samples collected at E18.5. Zfp800 wild-type (WT), heterozygous (Het) and knockout (KO) samples. n=3-4, error bars represent s.e.m. ****P≤0.0001; ***P≤0.001; **P≤0.01; *P≤0.05 (two-way ANOVA).

