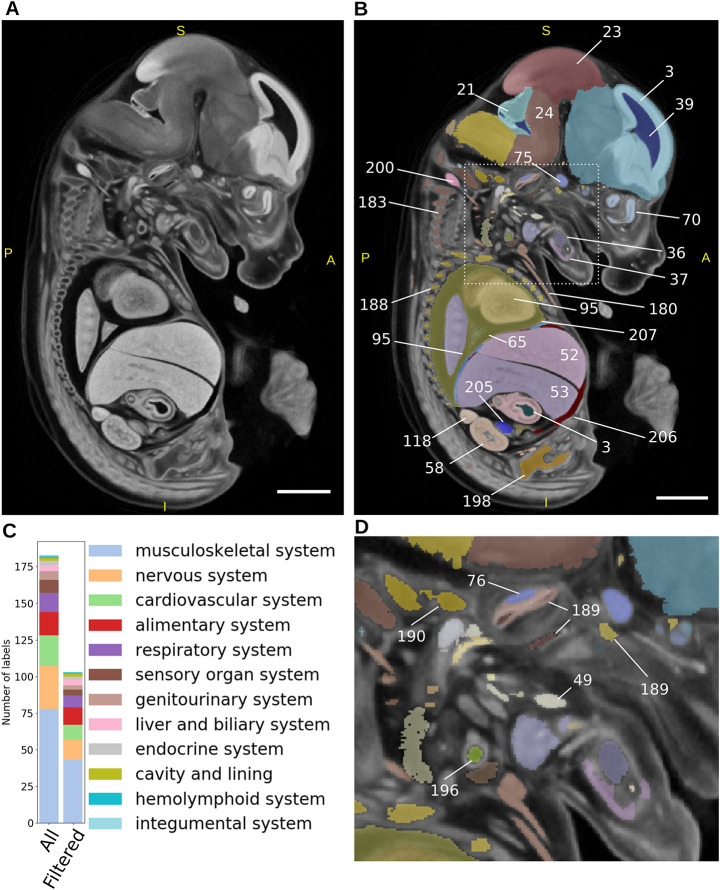
Fig. 2.
E14.5 atlas creation. (A) Sagittal view of the E14.5 population average created from 16 wild-type female and male E14.5 C57BL/6 mice. (B) Sagittal view of the E14.5 atlas consisting of 184 individual structures overlaid on the population average. Only a subset of labels is shown for illustrative purposes. Numbers indicate the labels assigned to segmented organs, which can be looked up in Table S1. (C) Breakdown of labels into corresponding organ systems for the whole atlas (All), and those remaining after filtering small or spindly labels (Filtered) (see Materials and Methods). (D) Expanded region from area outlined in B, highlighting more labels. Scale bars: 1 mm. S, superior; I, inferior; A, anterior; P, posterior.

