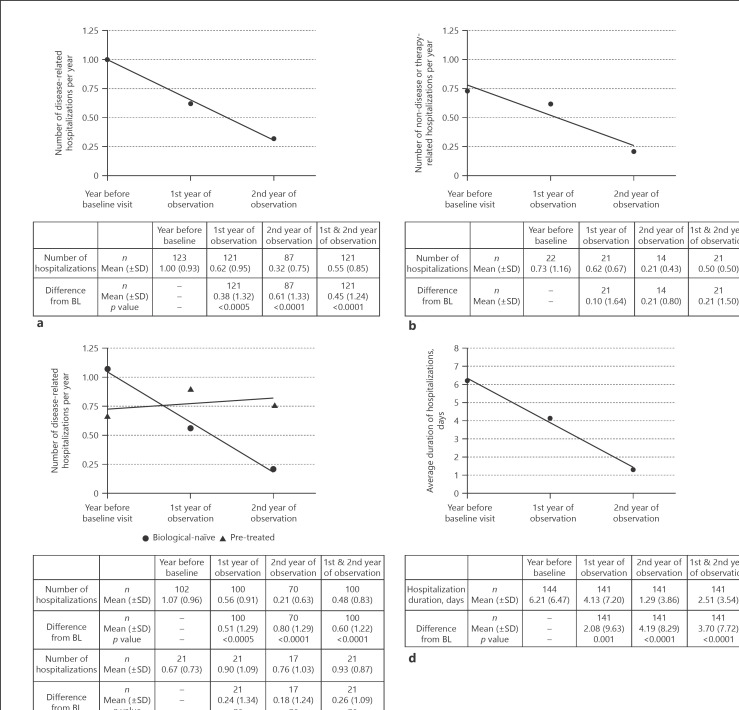
Fig. 2.
Disease-related and non-disease-related hospitalizations in CD patients. The number of disease-related hospitalizations is shown for all patients (a) and for biological-naïve (⚫) patients in comparison to pre-treated (▲) patients (c) for the year before BL visit and for the 1st and 2nd year of observation. Before BL means the number of disease-related hospitalizations documented during the 12 months before BL visit until BL visit (month 0). First year of observation represents the overall number of hospitalizations during the 1st year of observation which is counted from the day of BL visit + 1 until visit month 12. The 2nd year of observation sums up the number of hospitalizations during the 2nd year with an observation period starting on the day of visit in month 12 + 1 until visit month 24. For patients who early discontinued the study prior to visit month 24, the number of disease-related hospitalizations per year was extrapolated (either for the 1st or 2nd year of the observation period) as (number of disease-related hospitalizations × 365 [days])/observation period (days), with observation period = date of last visit (end) – date of BL (month 0). b Displays the non-disease or therapy-related number of hospitalizations showing no statistically significant results. The average duration of hospitalization is shown in (d). Statistical analyses were done on the descriptive model, and p values were calculated by the Wilcoxon signed-rank test for the mean difference from BL for the 1st, the 2nd, and the mean of the 1st and 2nd year. Linear regression lines were calculated using GraphPad Prism 7.05. ns, not significant; n, number of patients with available data for the respective time point; CD, Crohn's disease; BL, baseline.

