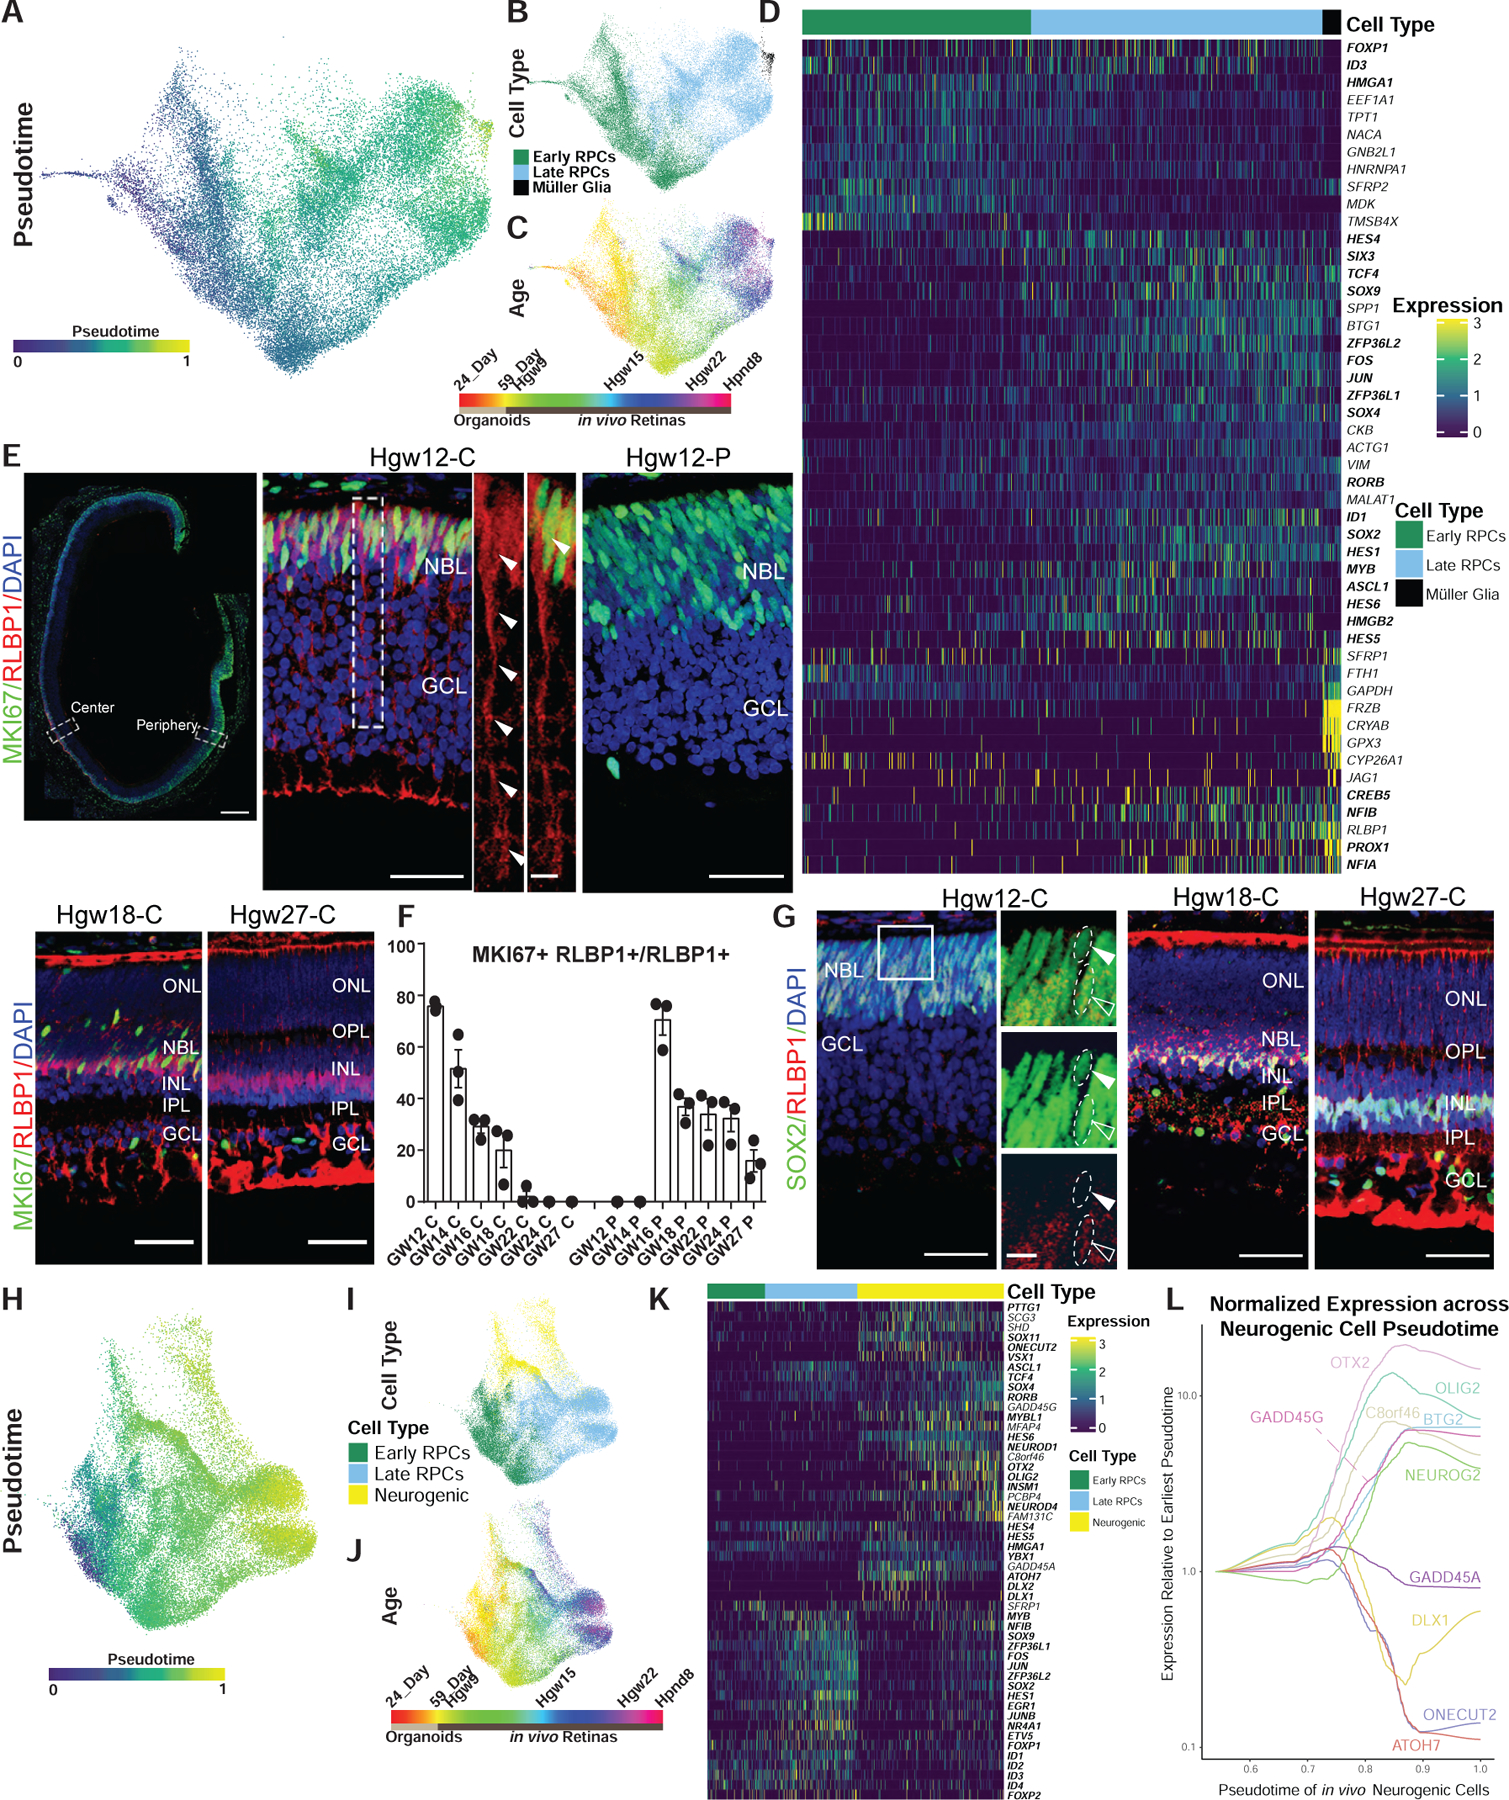
Figure 2. Pseudotime Analysis Reveals Genes Differentially Expressed across Primary and Neurogenic RPCs.

(A–C) UMAP embedding of the developmental trajectories of primary RPCs and Müller glia with cells colored by (A) pseudotime, (B) cell type, and (C) developmental age.
(D) Heatmap of differentially expressed transcripts along pseudotime from primary RPC to Müller glia. Cells are ordered by cell type and pseudotime with transcription factors listed in bold.
(E) Immunohistochemistry detection for RLBP1 and MKI67 in GW12 (top panels), GW18-Central (bottom left), and GW27-Central retina (bottom right) with magnified views of GW12 central (top center) and peripheral (top right) regions. Nuclei are counterstained with DAPI. GW12 scale bar: 300 μm(left), 50 μm(center and middle), 10 μm (center side panels); GW18-C and GW27-C scale bar, 50 μm.
(F) Bar chart showing the proportion of actively proliferating (MKI67+) cells among the RLBP1+ population, as detected by immunohistochemistry, in the central and peripheral regions across the developing human retina (GW12, GW14, GW16, GW18, GW22, GW24, and GW27). Data are mean ± SEM.
(G) Immunohistochemistry of SOX2 and RLBP1 in central regions of developing human retinas at GW12, 18, and 27. High-magnification images are of the boxed region in the GW12 image. Open arrowheads indicate co-localization, with closed arrowheads indicating failure to detect RLBP1 expression. Nuclei are counterstained with DAPI. GW12 scale bar, 50 μm (left), 10 μm (right); GW18-C and GW27-C scale bar, 50 μm.
(H–J) UMAP embedding of primary and neurogenic RPCs with cells colored by (H) pseudotime, (I) cell type, and (J) developmental age.
(K) Heatmap of differential transcript expression along pseudotime from primary RPC to neurogenic RPC. Cells are ordered by cell type and pseudotime with transcription factors listed in bold.
(L) Graph showing the normalized and smoothed expression of early and late neurogenic genes across the neurogenic trajectory relative to expression at the earliest point of neurogenic cell pseudotime. Abbreviations: Hgw, human gestational weeks; GW, gestational weeks; Hpnd, human postnatal day; NBL, neuroblast layer; GCL, ganglion cell layer; ONL, outer nuclear layer; OPL, outer plexiform layer; INL, inner nuclear layer; IPL, inner plexiform layer; C, central retina; P, peripheral retina.
