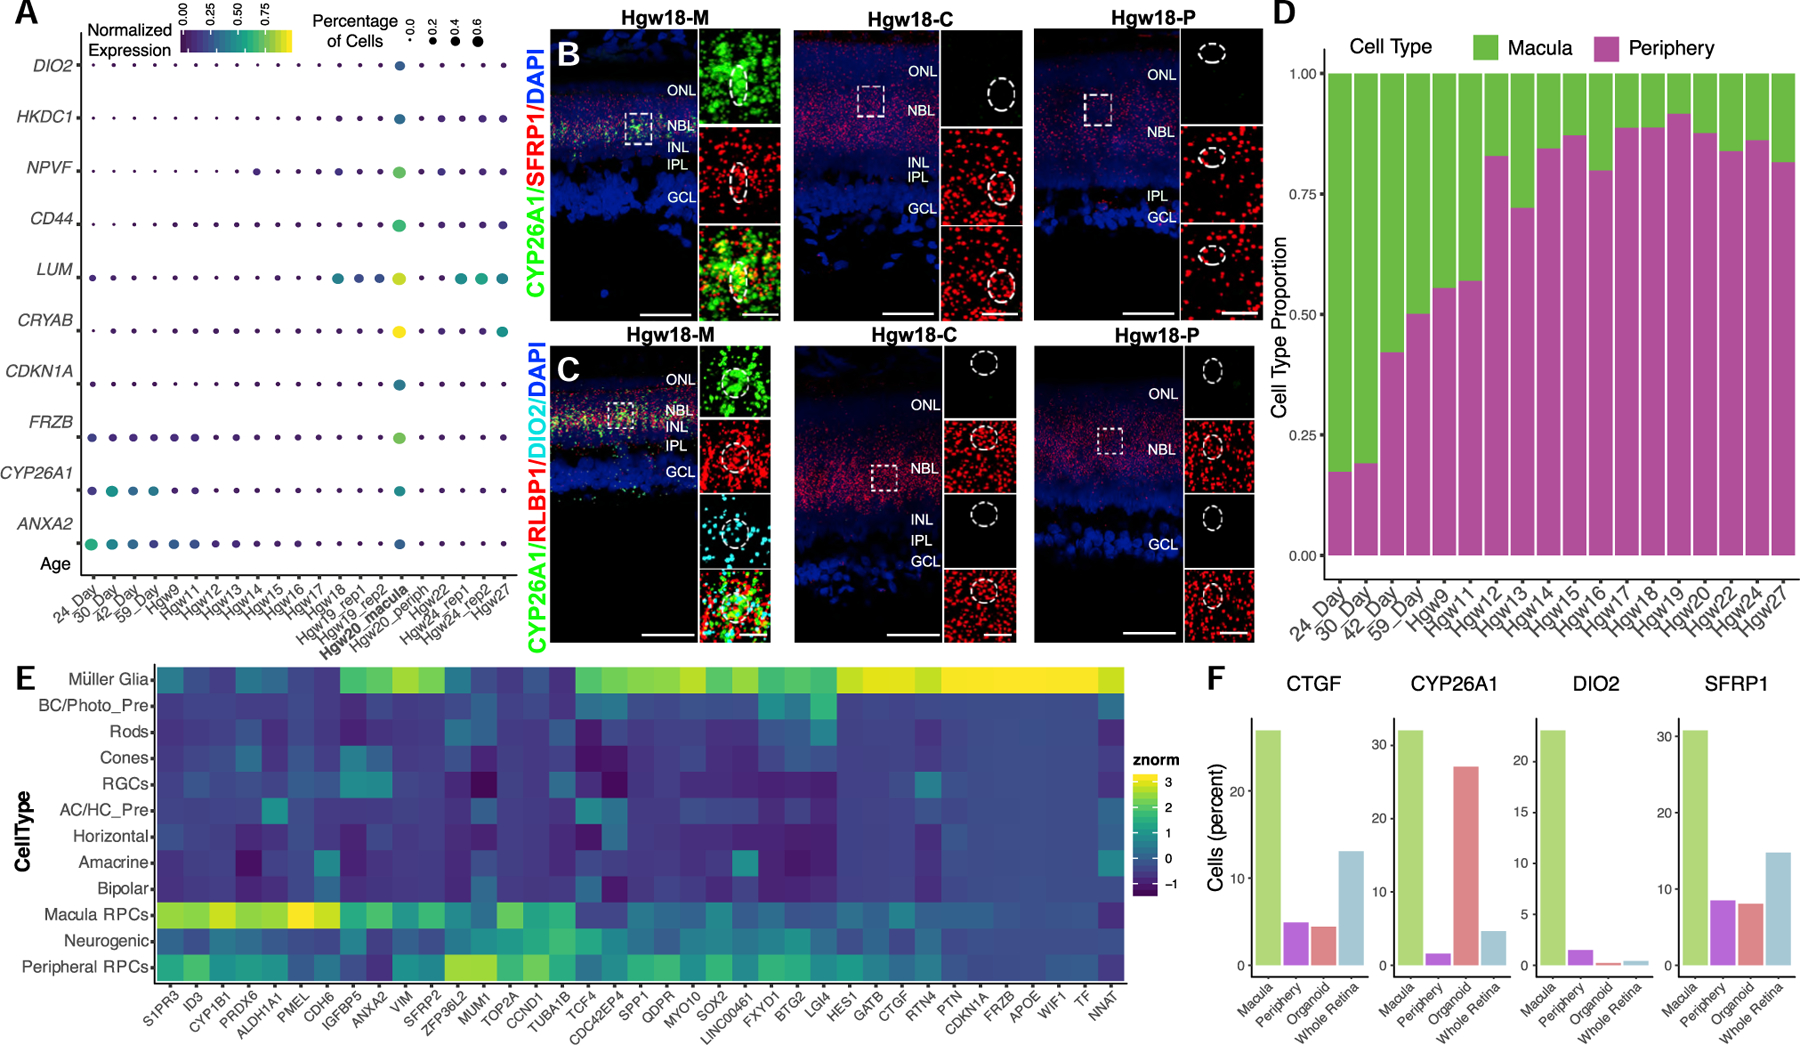
Figure 4. Identification of Macular RPC Transcripts for Regional Specification of the Developing Human Retina.

(A–C) (A) Dot plot of differentially expressed genes between macular and peripheral retina RPCs and their relative expression and percentage of expressing cells in RPCs in each sample. The bolded Hgw20_rep1 sample highlights a macular sample containing significant numbers of RPCs. (B and C) RNAscope detecting (B) CYP26A1 and SFRP1 and (C) CYP26A1, RLBP1, and DIO2 transcripts in macular, central, and peripheral Hgw18 retina samples with high-magnification images of boxed regions. Nuclei are counterstained with DAPI. Scale bar, 50 μm and 10 μm (magnified views).
(D) Proportion of macular and peripheral RPCs as classified by CYP26A1, CDKN1A, DIO2, ANXA2, or FRZB expression at each age.
(E) Heatmap showing cell-type expression enrichment of differentially expressed transcripts between the inferred macular and peripheral RPCs.
(F) Bar plots showing proportion of cells expressing macular RPC enriched genes within each sample type. Abbreviations: Hgw, human gestational weeks; M, macular retina; C, central retina; P, peripheral retina; NBL, neuroblast layer; GCL, ganglion cell layer; ONL, outer nuclear layer; OPL, outer plexiform layer; INL, inner nuclear layer; IPL, inner plexiform layer; RPCs, retinal progenitor cells; AC/HC Pre, amacrine cell/horizontal cell precursors; BC/Photo Pre, bipolar cell/photoreceptor precursors; RGCs, retinal ganglion cells.
