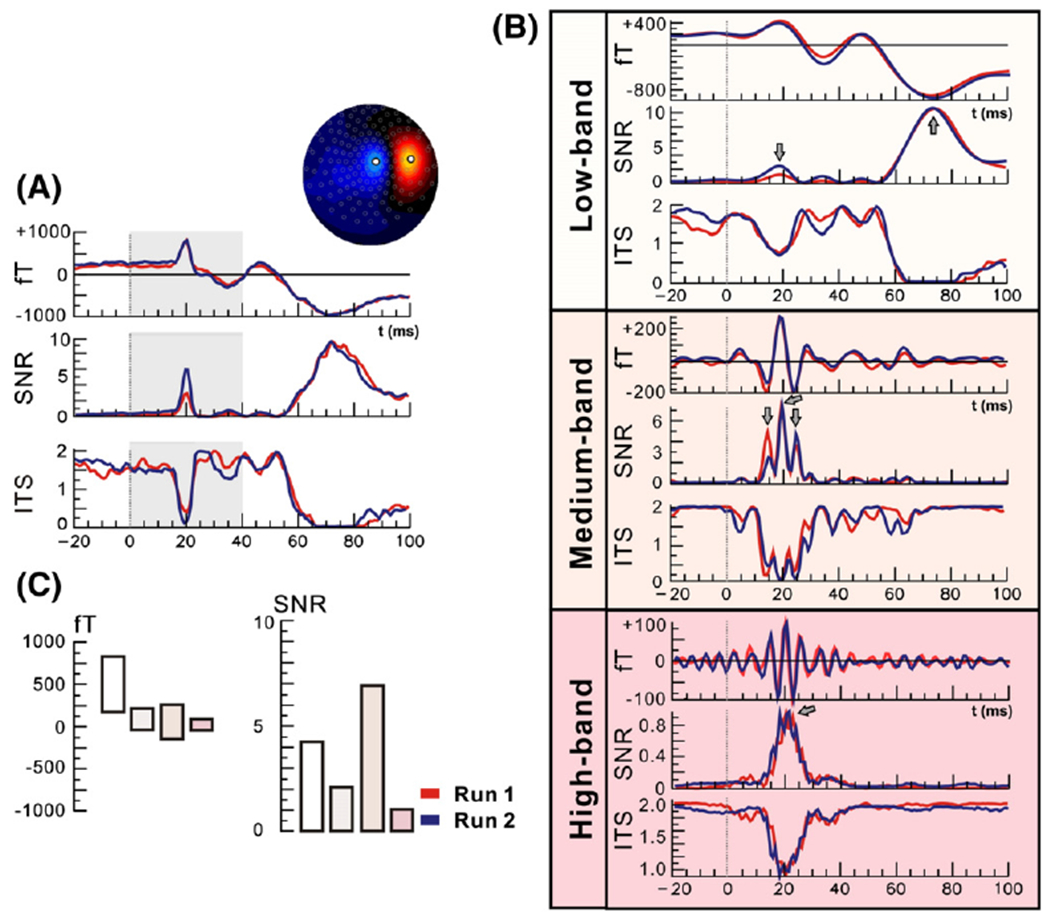
Fig. 4.

SEFs (in fT), SNR, and ITS of virtual channel (right wrist stimulation, one subject) for the whole frequency band (0–250 Hz) (A), and the low-band (0–50 Hz), medium-band (50–150 Hz), and high-band (150–250 Hz) (B) for two runs. The virtual channel was defined from the field map during the peak ofN20. (C) Displays derived from the same virtual channel at the peak ofM20 of peak-to-peak SEFs values (in fT) on the left and SNR on the right (averages between two runs). In each case the values displayed are in turn for the whole-band, the low-band, the medium-band and the high-band following the colors for each band as appear in (B). Note that the medium-band produces the highest SNR for the M20.
