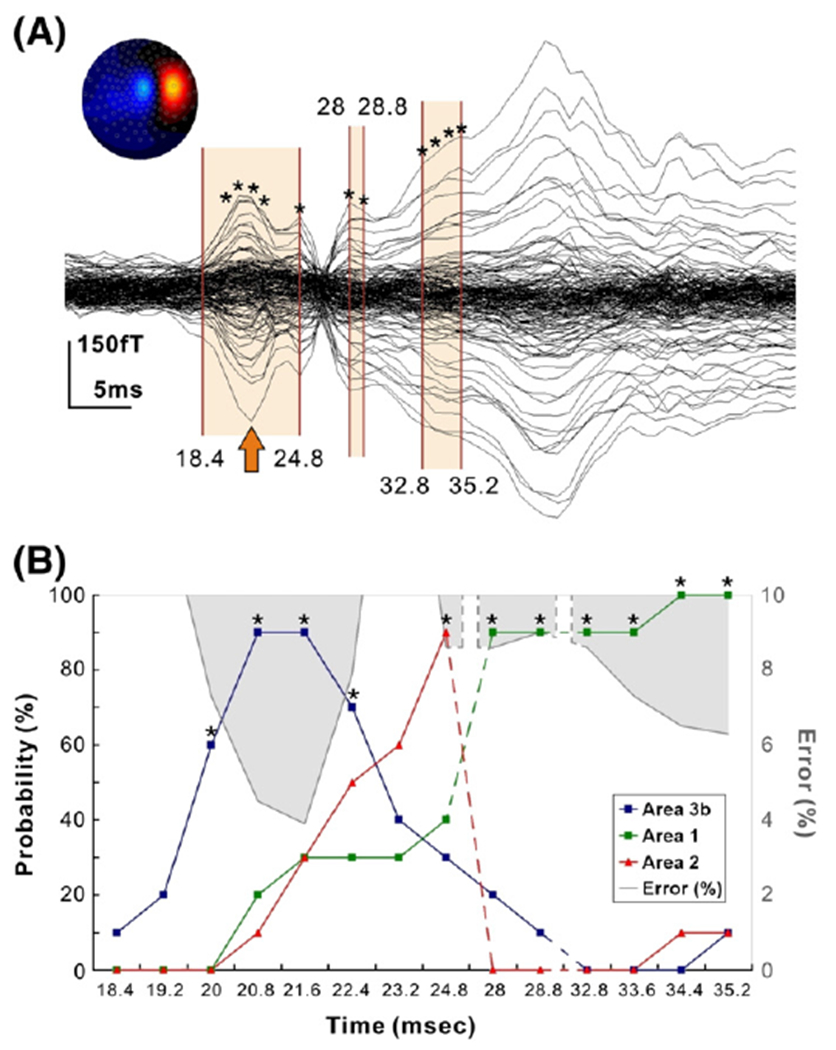
Fig. 8.

(A) Averaged SEFs (in fT) from left median nerve stimulation (subject 3, run 1, left wrist stimulation) filtered in the whole frequency band of 0–250 Hz. Contour map shows iso-magnetic fields during the N20 peak (indicated with an arrow), a single dipolar pattern over the right somatosensory area. Shaded areas indicate the time-ranges at which the ECD results are displayed on the lower panel. Asterisks indicate the time-points at which the ECD was fitted with GOF <90%. (B) For each ECD solution the estimated location is represented in MNI coordinates and the probability (%) of the PCM maps for that location to belong to specific cytoarchitectonic areas is computed and displayed in the diagram for BA3b (blue), BA1 (green) and BA2 (red). The grey shaded areas show the values of localisation error (%) = 100 — GOF for the ECD at each time-point. It is evident that high GOF (low error) is correlated with activity in one cytoarchitectonic area.
