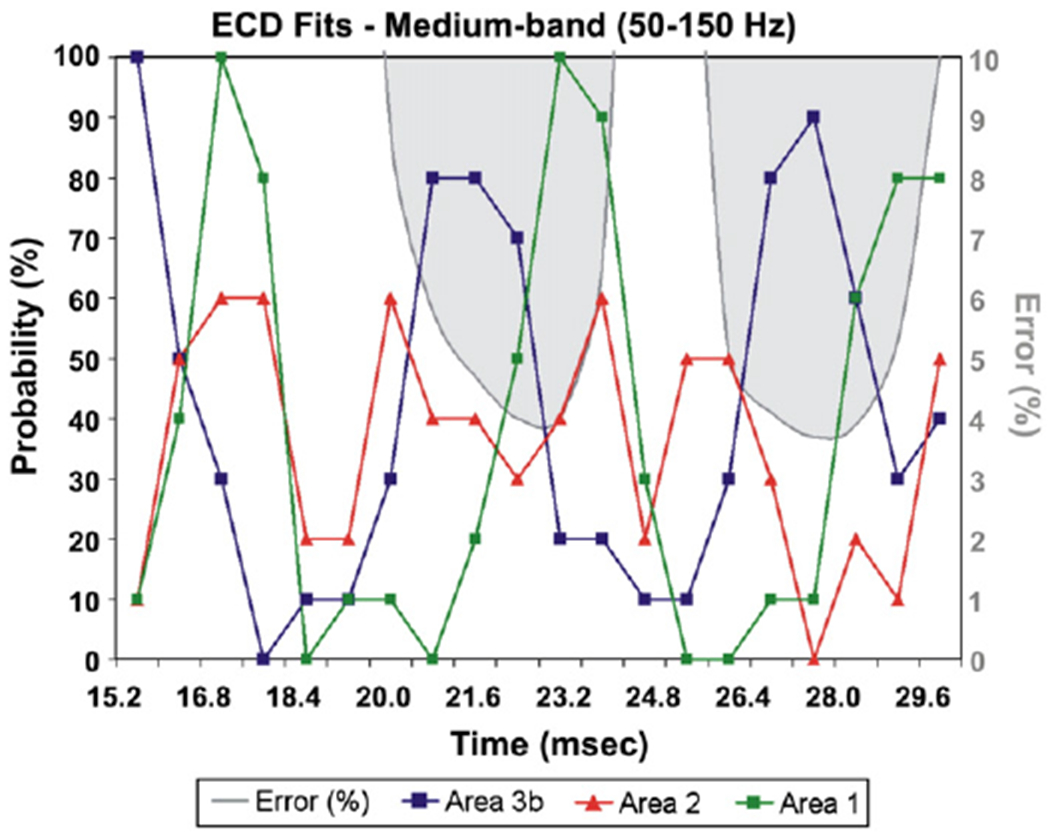
Fig. 9.

The PCM and GOF variation of the ECD solutions, fitted to the data filtered in the medium-band, for each time-point from 15.2 to 31.2 ms (subject 3, run 1, right wrist stimulation). For each latency, the ECD location is transferred to the MNI coordinate system and the probability (%) of the PCM is computed and displayed for areas BA3b, BA1 and BA2. The same conventions as for the lower part of Fig. 5. Note again that high goodness of fit corresponds either to cases where one area dominates (e.g. BA3b around 21 ms) or two nearby areas (transitions between 21 and 24 ms and 27 and 29 ms).
