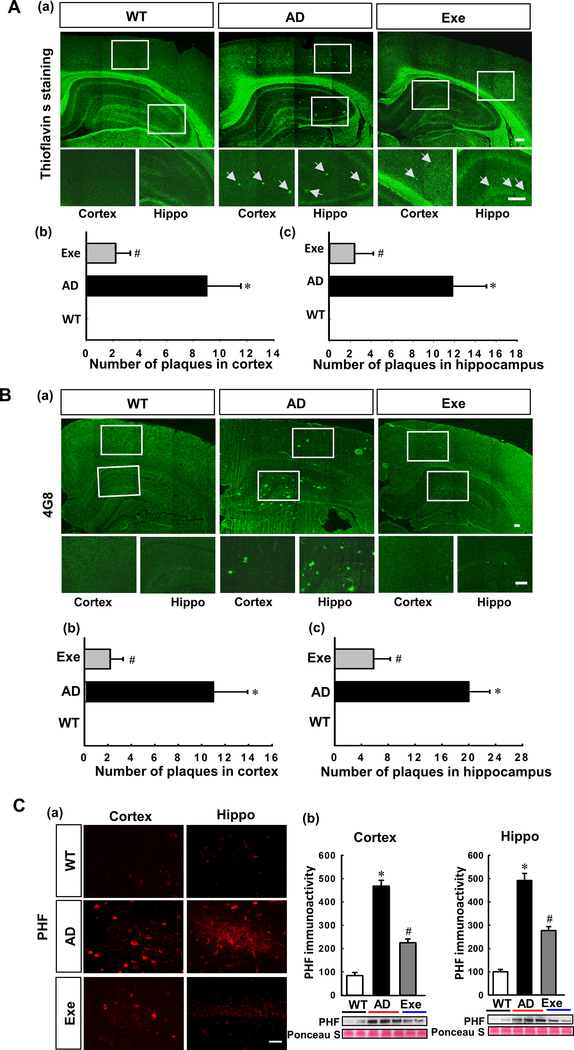
Figure. 4. Treadmill exercise training attenuates β-amyloid deposition and tau hyperphosphorylation in the cortex and hippocampus of TgF344-AD rats.
(A) Representative confocal microscopy images of ThioS staining (a) for WT, AD and AD+Exe groups in the cortex and hippocampus. Number of plaques in the cortex and hippocampus were counted and analyzed (b&c). Scale bar denotes 200 μm. (B) Sections from WT, AD and AD+Exe were subjected to immunofluorescent staining of Aβ (17–24) (clone 4G8). Representative confocal microscopy images were shown in (a). Number of Aβ plaques in the cortex and hippocampus were counted and analyzed (b&c). Scale bar denotes 20 μm. (C) Phosphorylation of tau protein (PHF) was examined by immunofluorescent staining (a) Scale bar represents 20 μm. Results of Western blot analysis of PHF were shown in (b) to further confirm the results of immunofluorescent staining. Ponceau S staining was used as loading control for Western blots, as shown in (b). All values are expressed as mean ± SEM. *P < 0.05 vs WT group, #P < 0.05 vs AD group. Hippo, Hippocampus. Areas enclosed in white boxes were enlarged below their respective image.

