
Figure 7.
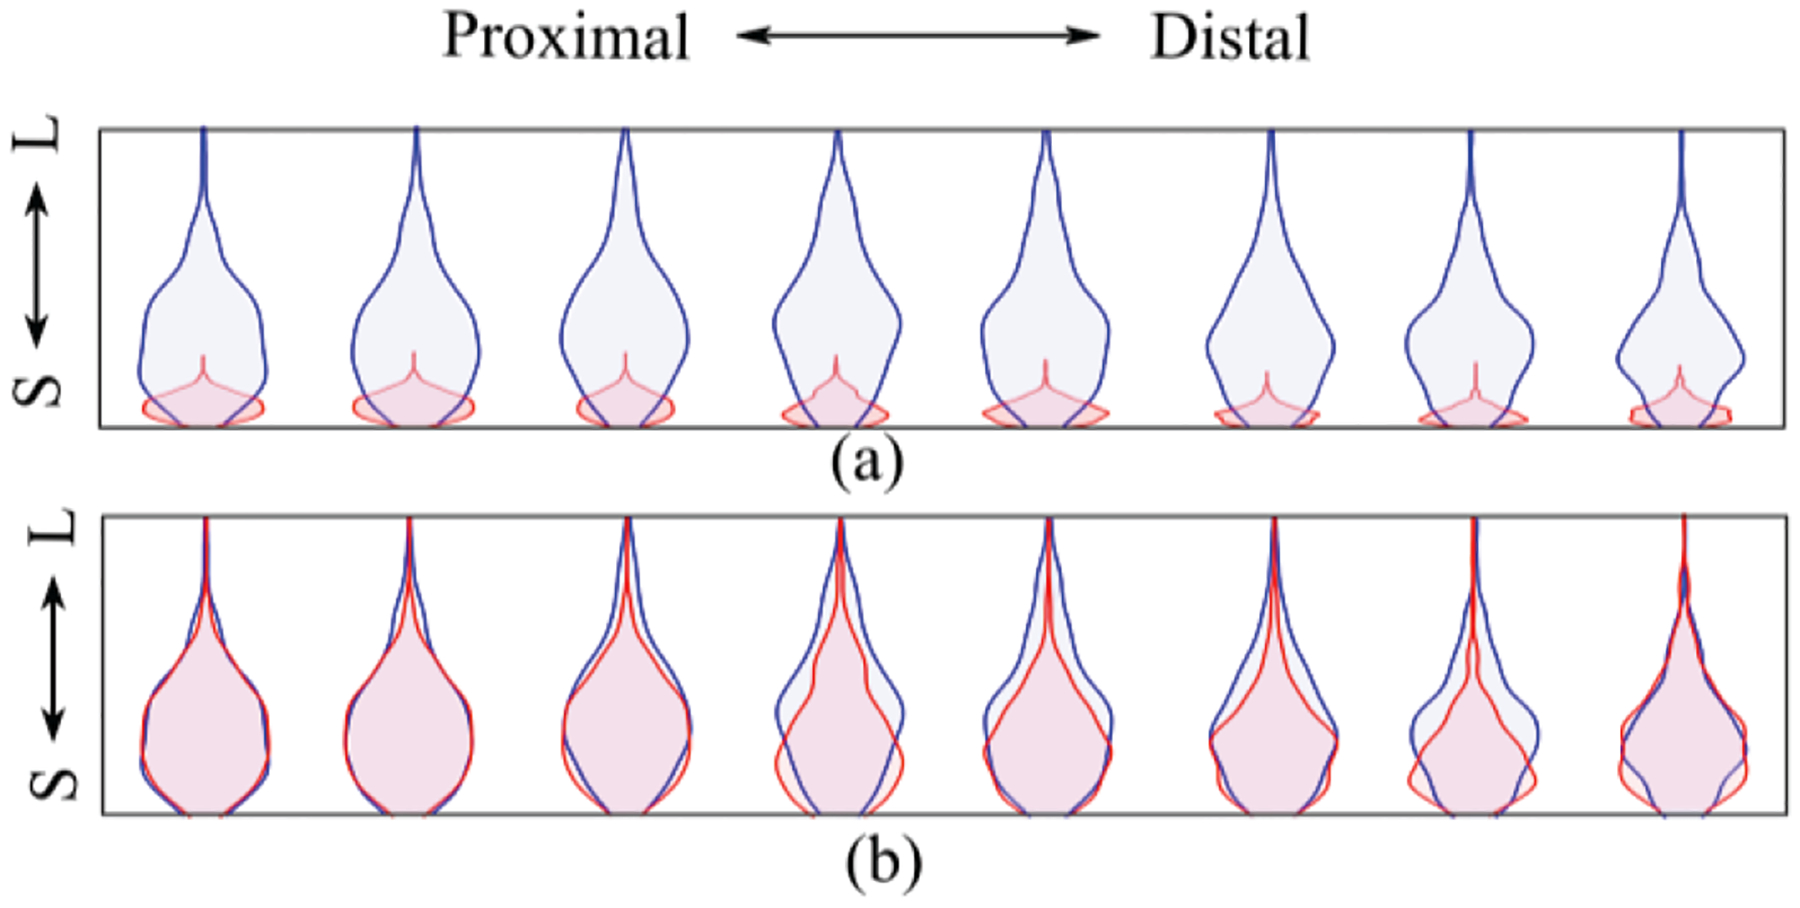
(a) Distribution of the peaks detected in the central column (column 4) during 60% MVC using tattoo electrode (blue) and commercial electrode (red) from small (S) to large (L). (b) Distribution of peaks normalized to maximum value of the respective electrode channel.