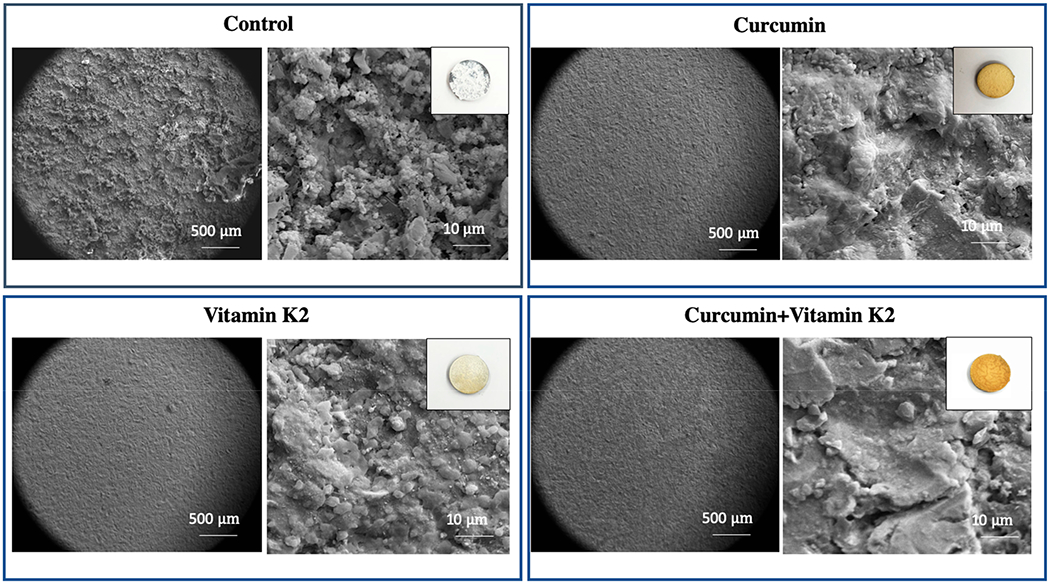
Figure 5.

Morphology of sample surface control, curcumin, vitamin K2, and curcumin + vitamin K2 after drug release for 22 days under pH 5.0 (acetate buffer). (Images of samples after 22 days of drug release show surface and coating degradation.) Data were expressed as mean ± SD [n = 3].
