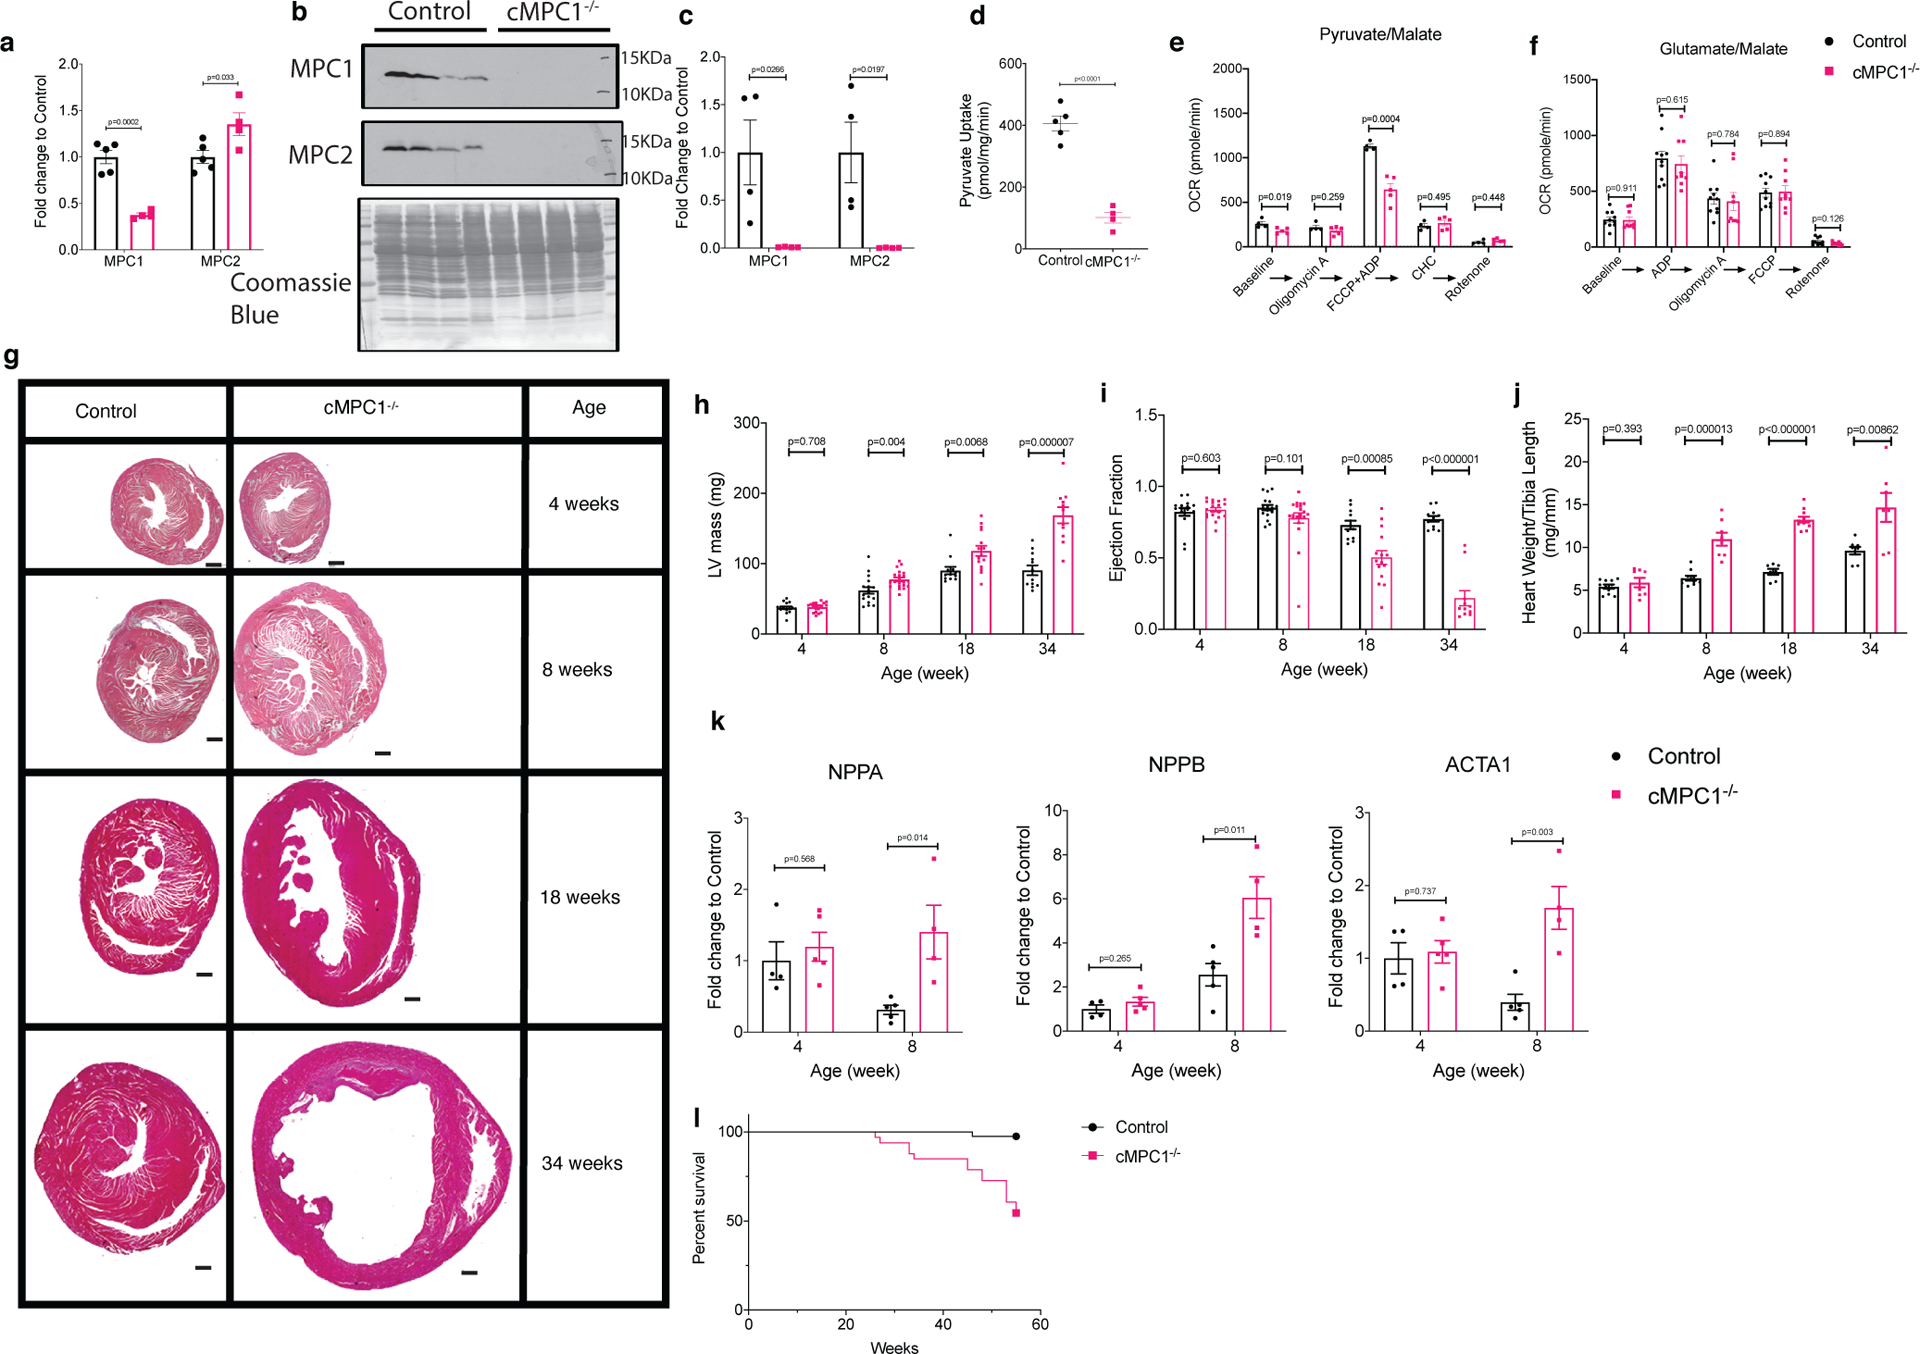
Figure 1. Generation and phenotype of cMPC1−/− mice.

(a-c) Loss of MPC1 was confirmed by qPCR (a) in heart lysates of 4-week-old cMPC1−/− (Sample size (n): Control, 5; cMPC1−/−, 4) and Western blot (b-c) in isolated cardiomyocytes from 8-week-old cMPC1−/− mice (n: Control, 4; cMPC1−/−, 5). (d) Mitochondrial pyruvate uptake was performed in mitochondria isolated from 8-week-old cMPC1−/− hearts (n: Control, 5; cMPC1−/−, 4). (e-f) Oxygen consumption rates (OCR) were determined by Seahorse respirometry in isolated mitochondria from 8-week-old cMPC1−/− hearts in the presence of pyruvate (1 mmol/L)/malate (0.25 mmol/L) (e) (n: Control, 4; cMPC1−/−, 4) and glutamate (1mmol/L)/malate (0.25 mmol/L) (f) (n: Control, 10; cMPC1−/−, 9). Concentration of the MPC inhibitor, CHC was 1mM. See methods for concentrations of other inhibitors. (g) Midventricular cross sections of cMPC1 and control hearts at the ages as shown. Scale bar, 500 μm. Images are representative of n= 3 per group. (h-i) LV Mass and Ejection Fraction by echocardiography (j) Heart weight to tibia length ratio (HW/TL) at the ages as shown. Sample size (n) is represented as Control/cMPC1−/−. For h-i, 4-week-old and 8-week-old: 17/21; 18-week-old: 12/15; 34-week-old: 12/12. For j, 4-week-old: 11/8; 8-week-old: 10/8; 18-week-old: 7/11; 34-week-old: 8/7.) (k) mRNA levels of hypertrophic genes, ANP (NPPA), BNP (NPPB) and ACTA1 were determined by qPCR in 4- and 8-week-old cMPC1−/− hearts. For k, 4-week-old: 4/5; 8-week-old: 5/4. (l) Survival curves of control and cMPC1−/− mice over a 1-year period (Control, 34; cMPC1−/−, 30). Data are presented as mean ± SEM and analyzed by two-tailed unpaired Student’s t-test.
