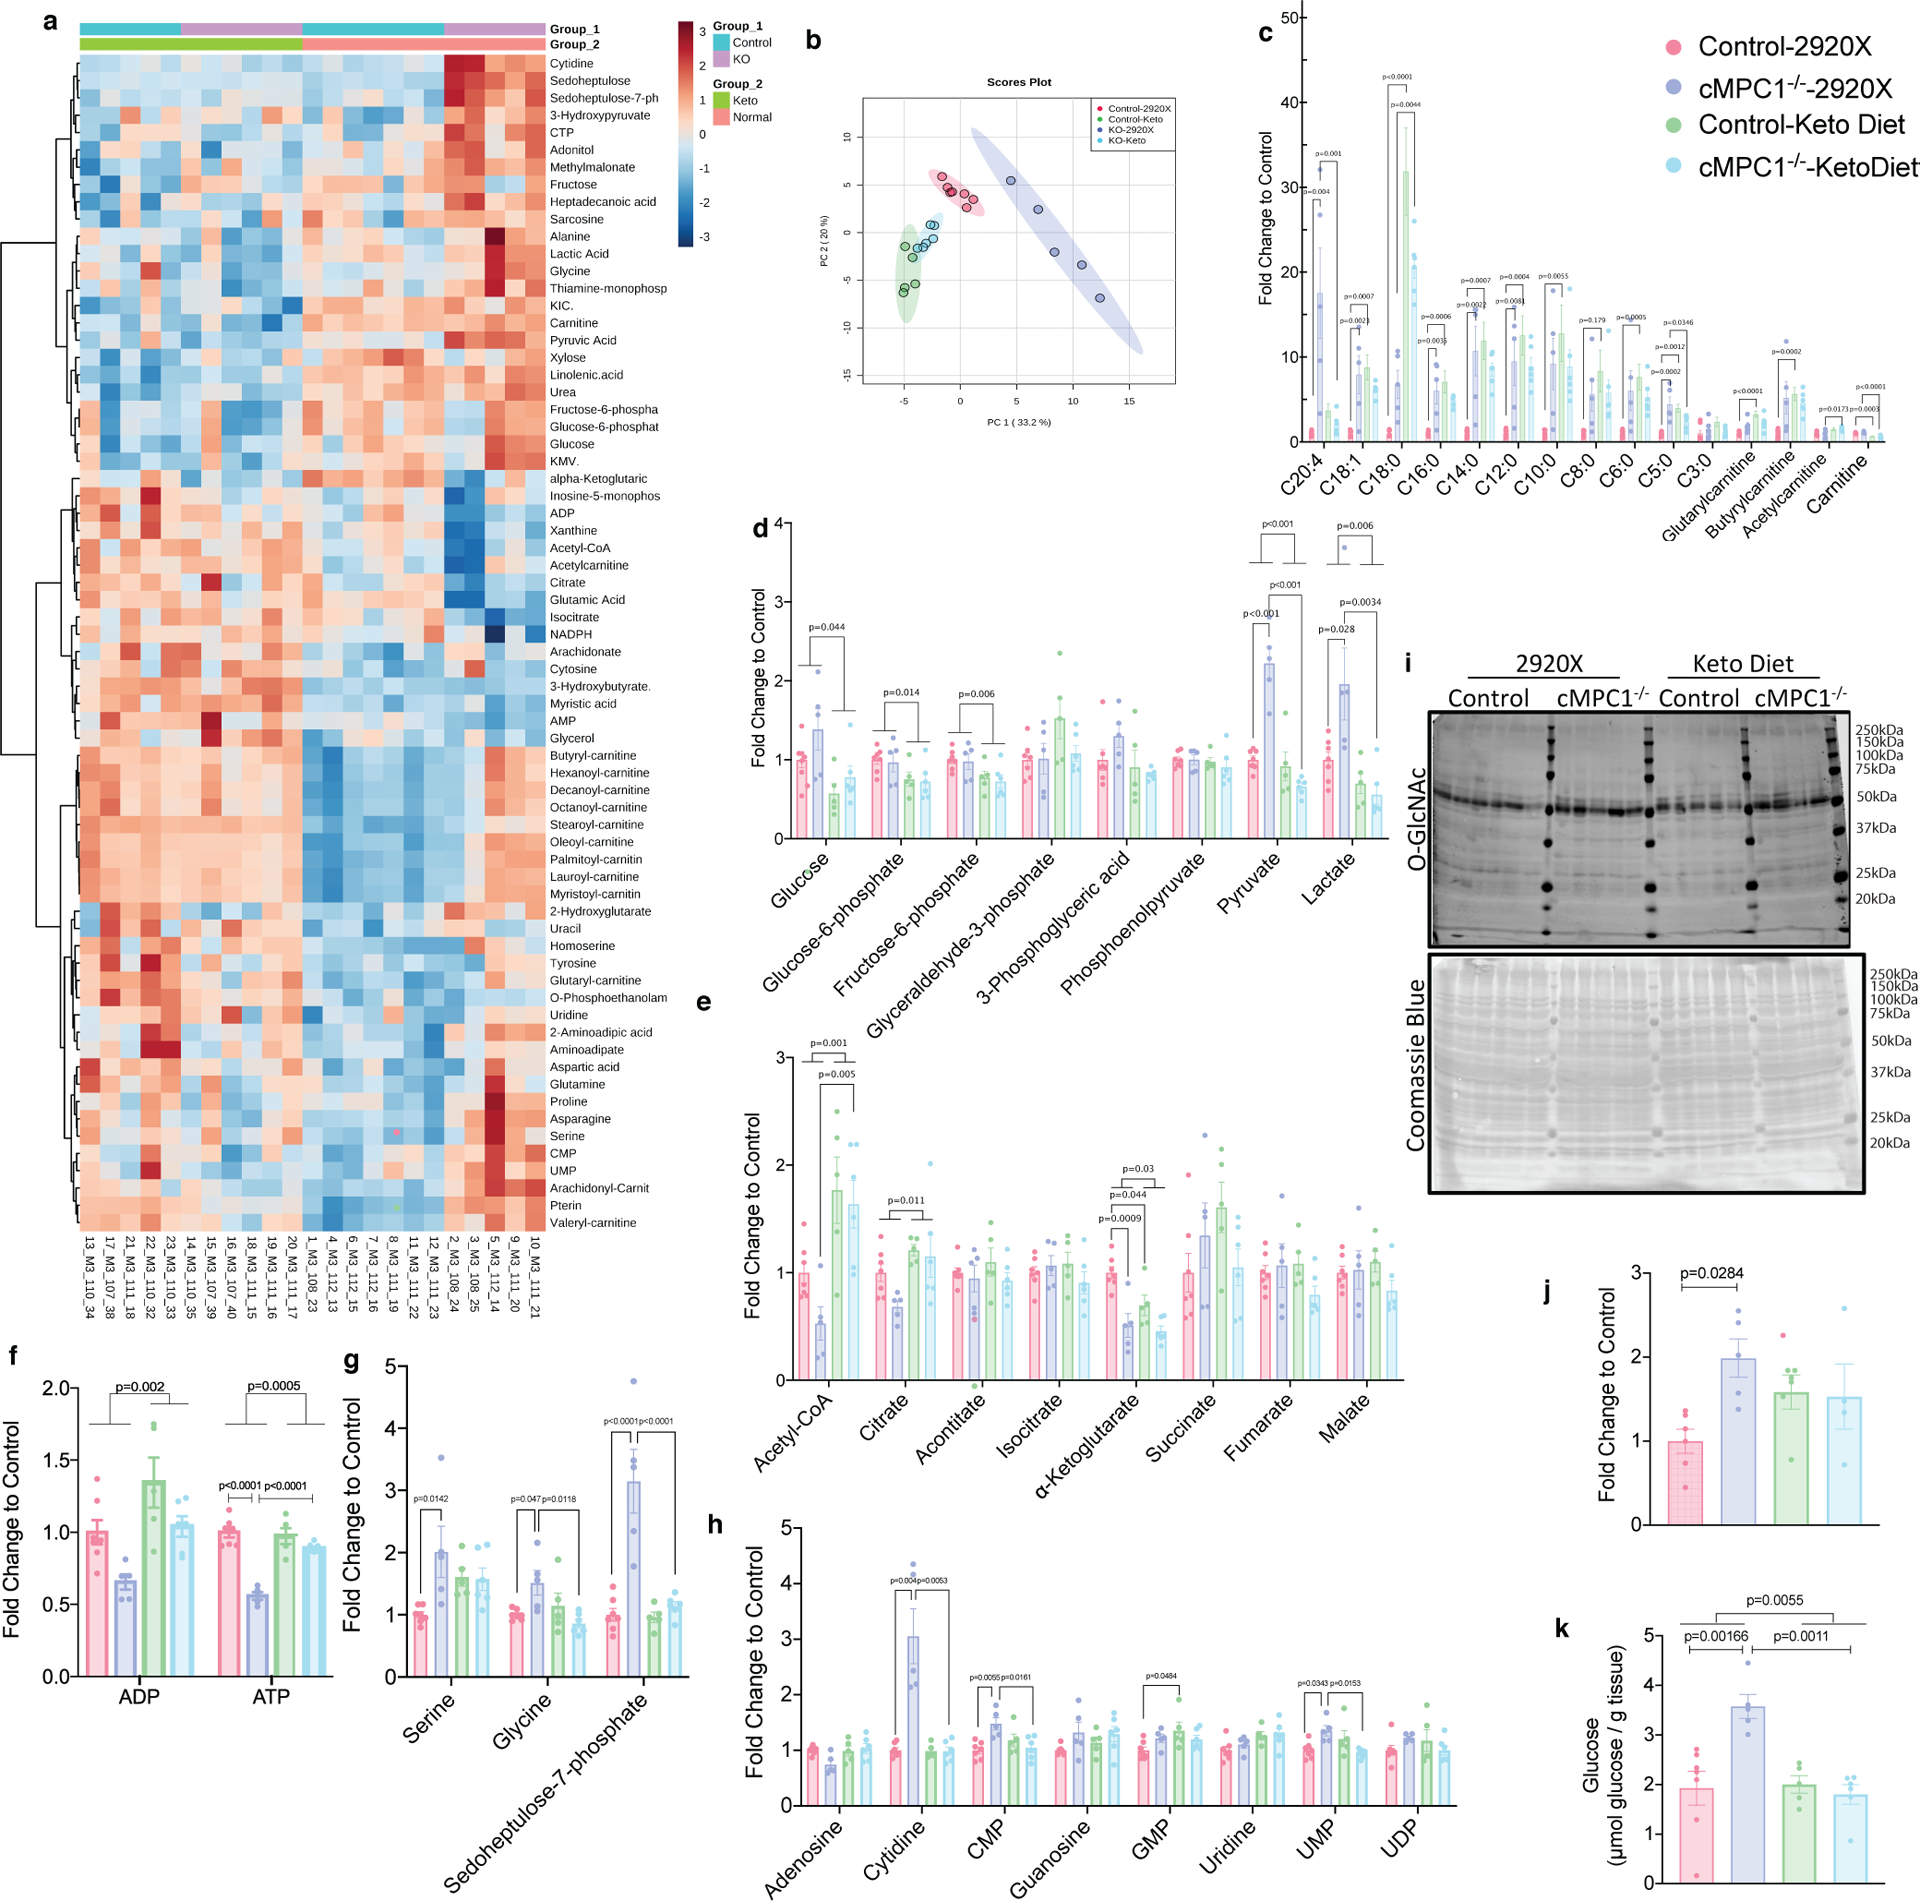
Figure 7. Metabolite Profiles in KD hearts.

Control and cMPC1−/− mice were fed with ketogenic diet starting at the age of 8 weeks and hearts were freeze-clamped after 6 weeks of feeding. GC-MS and LC-MS were employed to determine levels of metabolites in the heart tissue. The fold change of all metabolites was normalized to control hearts fed on normal chow (2920X). Two-way heatmap (a) and Principal Component Analysis (PCA) (b) were analyzed and plotted by MetaboAnalyst. Acyl-carnitines(c), glycolysis intermediates (d), CAC intermediates (e), ADP and ATP (f), PPP and SBP intermediates (g) and nucleotides (h) were plotted and analyzed by two-way ANOVA followed by Tukey multiple comparison test. Sample sizes are as follows: n=7 (Control-2920X), n=5 (cMPC1−/−−2920X), n=5 (Control-Keto), n=6 (cMPC1−/−-Keto). O-GlcNAc blot (i) normalized to total Coomassie blue staining (i) and glycogen storage (k) was determined in 18-week-old control and cMPC1−/− mice after 8 weeks of KD (Protocol 2). For panel j, sample sizes are as follows: n=6 (Control-2920X), n=5 (cMPC1−/−−2920X), n=5 (Control-Keto), n=4 (cMPC1−/−-Keto). For panel k, sample sizes are as follows: n=7 (Control-2920X), n=5 (cMPC1−/−−2920X), n=5 (Control-Keto), n=6 (cMPC1−/−-Keto). Data are presented as mean ± SEM and analyzed by two-way ANOVA followed by Tukey multiple comparison test. All P values <0.05 are shown on the figure panels. If not indicated, then P values are >0.05.
