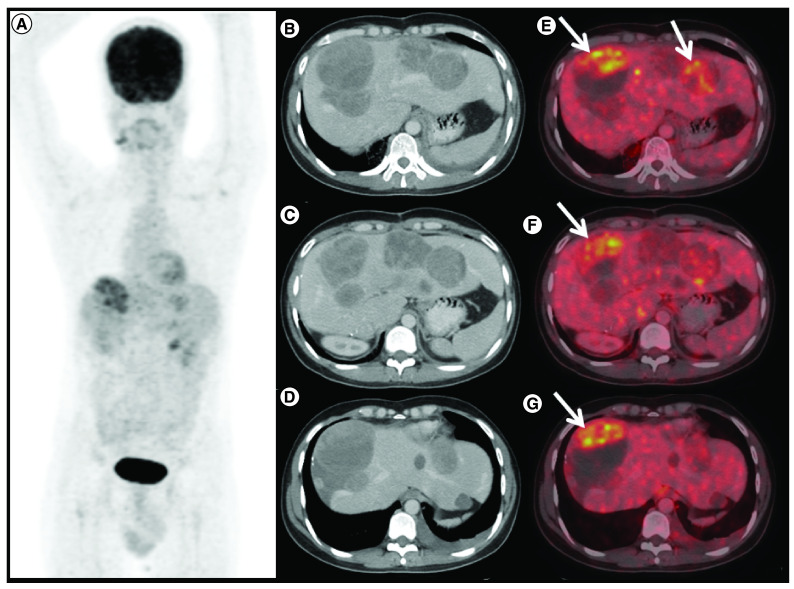
Figure 2. . Response to avapritinib therapy in case 1.
18F-FDG positron emission tomography/computed tomography (PET/CT) done 6 months after avapritinib therapy in patient A. (A) Maximum intensity projection, (B, C & D) axial contrast enhanced CT and (E, F & G) fused PET/CT images shows increase in size of the liver lesions with FDG avid enhancing areas in the periphery of the lesion (arrows), suggestive of progressive disease.

