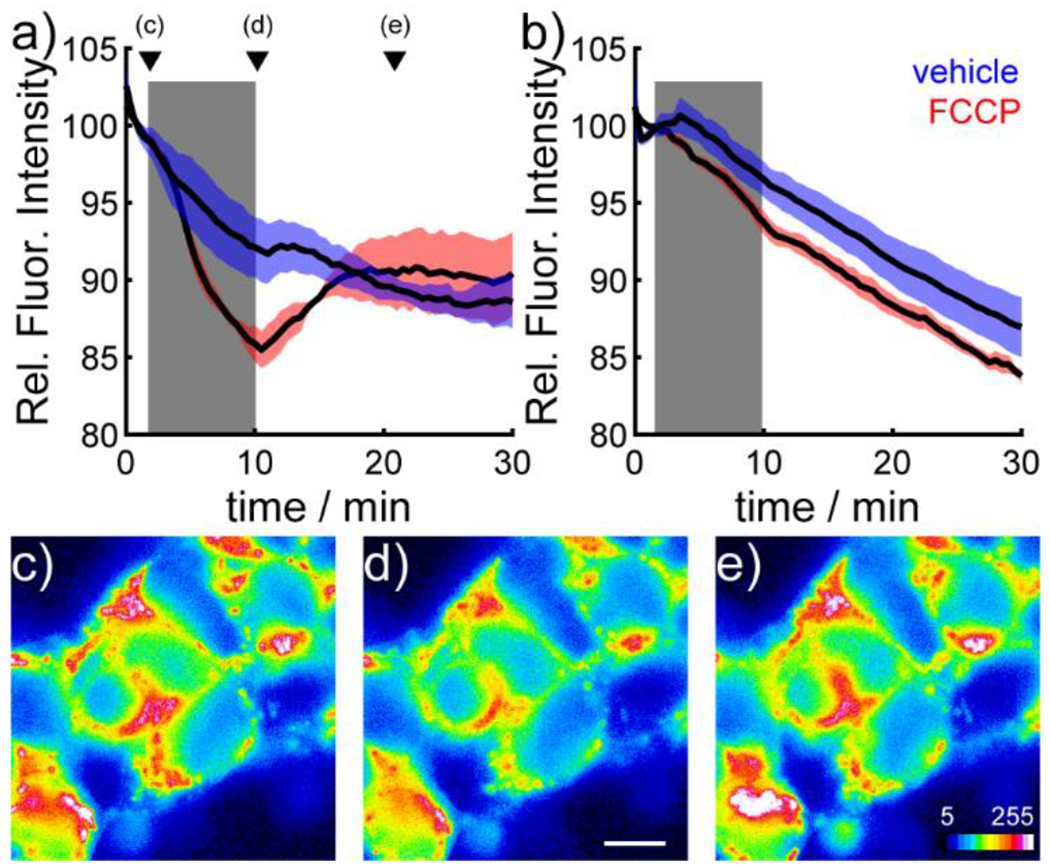
Figure 3.

SPIRIT RhoVR 1 reports on ΔΨm dynamics in HEK cells. Plot of fluorescence intensity vs. time for HEK cells stained with a) SPIRIT RhoVR 1 (150 nM) or b) SPIRIT RhoVR 0(150 nM). At 2 minutes into the experiment (beginning of grey box) cells were perfused with either vehicle (ethanol, blue) or FCCP (500 nM, red). At 10 minutes (end of grey box) cells were perfused with HBSS. Data are mean (black line) ± S.E.M. (colored shading) for 3 separate experiments. Representative pseudocolor images of SPIRIT RhoVR 1-loaded HEK cells c) before, d) during, and e) after treatment with FCCP (500 nM). Scale bar is 10 μm for all images. Arrowheads in panel (a) indicate the timepoints of the representative images in panels c-e.
