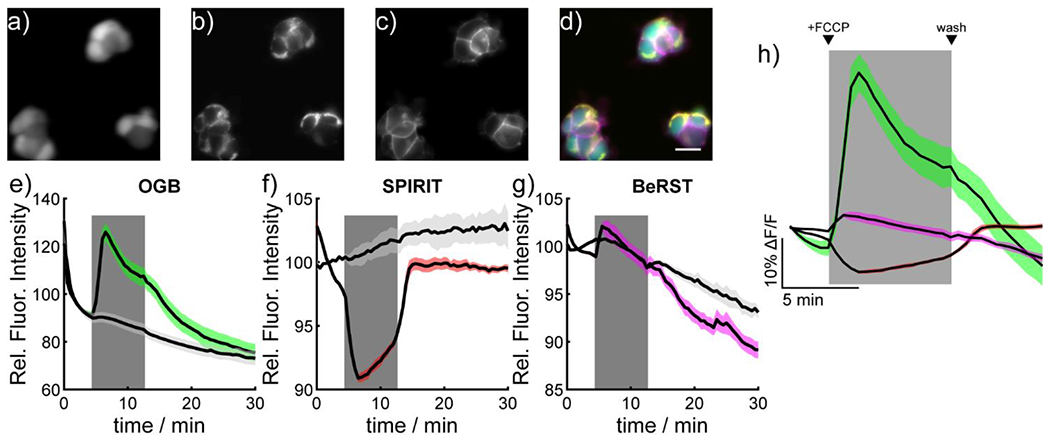
Figure 4.

Simultaneous, multicolor imaging of mitochondrial membrane potential, cytosolic Ca2+, and plasma membrane potential in mammalian cells. Widefield epifluorescence image of HEK cells stained with a) Oregon Green BAPTA-AM (OGB, 500 nM), b) SPIRIT RhoVR 1 (SPIRIT, 150 nM), c) and BeRST 1 (50 nM). d) An overlay of the images cytosolic localization of OGB (green), mitochondrial localization of SPIRIT RhoVR 1 (yellow), and plasma membrane localization of BeRST (magenta). Scale bar is 20 μm. Plots of fluorescence vs. time from HEK cells stained with e) OGB, f) SPIRIT RhoVR 1, or g) BeRST. At 4 minutes into the experiment (beginning of grey box) cells were perfused with either vehicle (ethanol, light grey) or FCCP (500 nM, colored trace). At 4 minutes (end of grey box) cells were recovered by perfusion with HBSS. Data are mean (black line) ± S.E.M. (colored shading) for 3 separate experiments. h) Shows a zoomed-in plot of the response of OGB (green), SPIRIT RhoVR 1 (red), and BeRST 1 (magenta). The grey box indicates the start and end of FCCP perfusion.
