Figure 4.
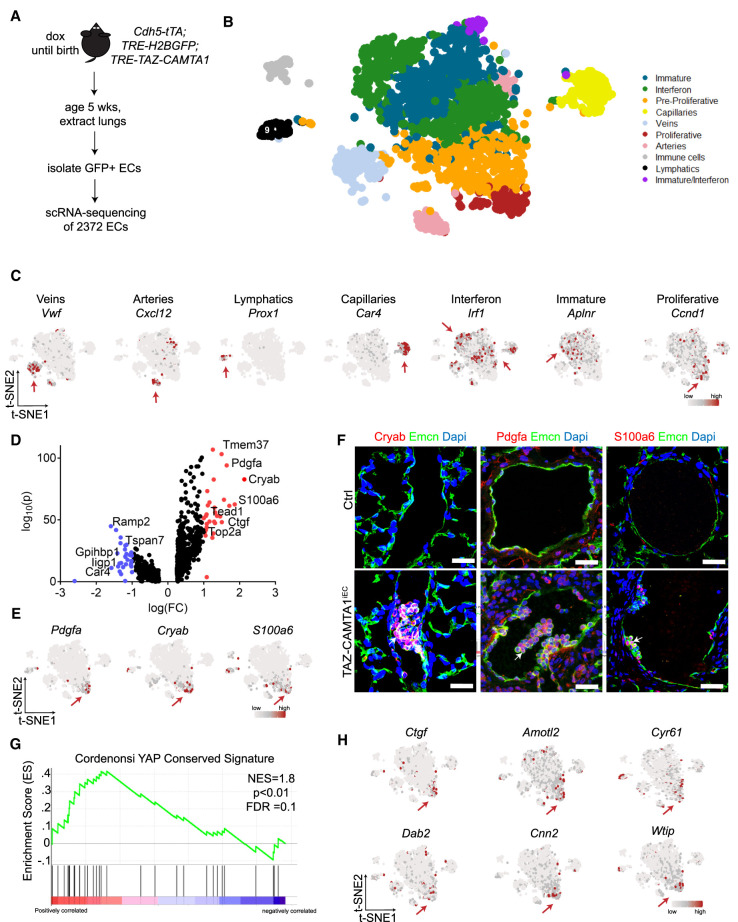
TAZ-CAMTA1 drives a proliferative endothelial cell population with a YAP/TAZ target gene signature. (A) Schematic for isolation of lung ECs for scRNA-seq. (B) t-SNE plot of clusters of cells observed from scRNA-seq. (C) t-SNE plots showing expression of various marker genes. Red arrows point to cluster showing positive expression. (D) Volcano plot of 806 differentially expressed genes in TAZ-CAMTA1-induced proliferative subpopulation. Wilcoxon rank sum test, adjusted P-value < 0.05. Genes in red have a log(FC) > 1 and genes in blue have a log(FC) < 1. Some pertinent genes and their corresponding points are marked. (E) t-SNE plots of markers from proliferative subpopulation. (F) Immunostaining validation of differentially expressed genes identified from scRNA-seq analysis. White arrows point to positive staining of Pdgfa, Cryab, or S100a6 in P40 TAZ-CAMTA1iEC but not Ctrl lung vessels. Scale bars, 25 µm. (G) GSEA plot showing normalized enrichment score (NES) of YAP-conserved signature in the proliferative subpopulation, NES = 1.8. P < 0.01, FDR = 0.1. (H) t-SNE plots of canonical YAP/TAZ target genes. Red arrows point to the proliferative cluster showing high expression of these genes.

