Figure 6.
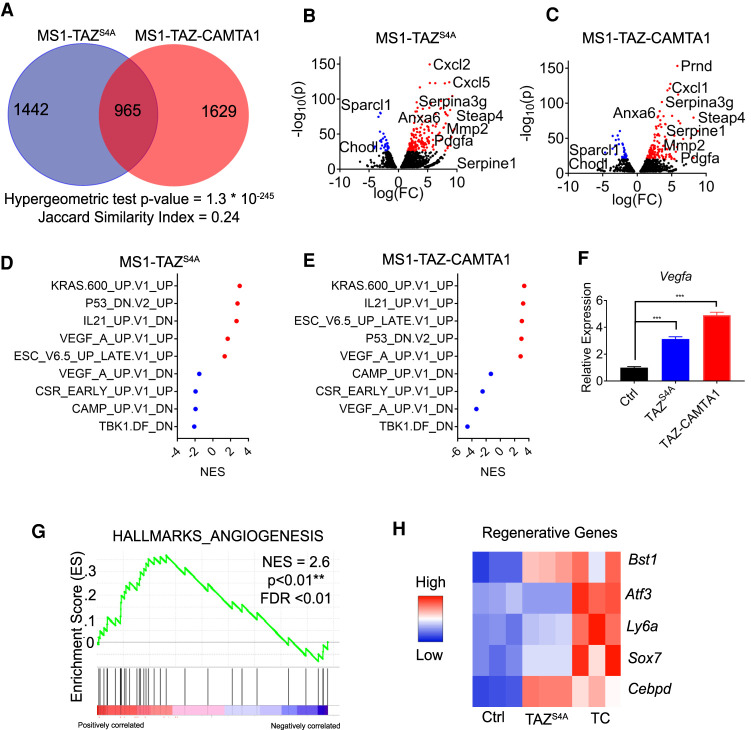
TAZ-CAMTA1 and TAZS4A drive a gene program associated with angiogenesis and regeneration. (A) Number of differentially expressed genes (DEG; FDR < 0.01) in MS1 cells expressing TAZS4A or TAZ-CAMTA1 as compared with control MS1 cells. Overlapped region indicates genes expressed in both populations. Hypergeometric test P-value and Jaccard index are indicated. (BC) Volcano plot of DEGs of TAZS4A or TAZ-CAMTA1. Red (overexpressed) and blue (underexpressed) are genes with −log10(p) > 25. (D,E) Normalized enrichment scores (NES) for selected oncogenic pathways in MS1 cells expressing TAZS4A or TAZ-CAMTA1 as determined by GSEA. Red indicates positive enrichment and blue indicates negative enrichment. (F) qPCR for Vegfa expression in control MS1 cells (1.0 ± 0.0, n = 3) and MS1 cells expressing TAZS4A (3.1 ± 0.1, n = 3) or TAZ-CAMTA1 (4.9 ± 0.1, n = 3). (***) P < 0.001. one-way ANOVA with post-hoc Tukey test. All data are mean ± SEM. (G) Enrichment of an angiogenesis gene signature in TAZ-CAMTA1-expressing MS1 cells, NES = 2.6. (**) P < 0.01, FDR < 0.01. (H) Heat map showing expression of selected regenerative endothelial cell markers in TAZS4A- or TAZ-CAMTA1-expressing MS1 cells.

