Figure 7.
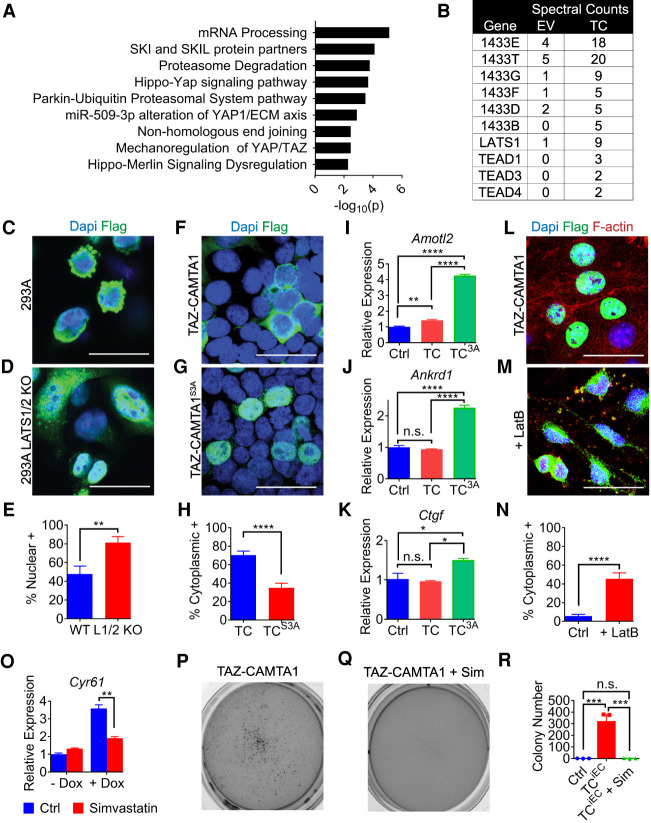
TAZ-CAMTA1 is still susceptible to regulation by the Hippo pathway. (A) Gene ontology plot of TAZ-CAMTA1-binding proteins identified by mass spectrometry. (B) Spectral counts of Hippo pathway-related proteins identified in anti-FLAG immunoprecipitates from 293T cells expressing either empty vector (EV) or 2×-FLAG-TAZ-CAMTA1 (TC). (C–E) Immunostaining of transfected FLAG-tagged TAZ-CAMTA1 in 293A cells (C) or 293A LATS1/2 KO cells (D). 293A LATS1/2 KO (81.3% ± 6.4%, n = 6) cells had significantly more TAZ-CAMTA1 localized to the nucleus than 293A cells (47.8% ± 8.3%, n = 6). (**) P < 0.01, unpaired t-test. (F–H) Immunostaining of transfected FLAG-tagged TAZ-CAMTA1 or TAZ-CAMTA1S3A in 293T cells. TAZ-CAMTA1 (70.3% ± 4.4%, n = 10) was significantly more localized to the cytoplasm than TAZ-CAMTA1S3A (35.0% ± 4.9%, n = 10). (****) P < 0.0001, unpaired t-test. (I,J,K) qPCR for expression of Amotl2 (I), Ankrd1 (J), and Ctgf (K) in MS1 cells stably expressing empty vector (Ctrl), TAZ-CAMTA1 (TC), or TAZ-CAMTA1S3A (TC3A). Cells expressing TAZ-CAMTA1S3A had significantly increased expression of Amotl2 (Ctrl: 1.0 ± 0.1, n = 3; TC: 1.4 ± 0.1, n = 3; TC3A: 4.3 ± 0.1, n = 3), Ankrd1 (Ctrl: 1.0 ± 0.1, n = 3; TC: 0.9 ± 0.0, n = 3; TC3A: 2.3 ± 0.1, n = 3), and Ctgf (Ctrl: 1.0 ± 0.3, n = 3; TC: 1.0 ± 0.0, n = 3; TC3A: 1.5 ± 0.0, n = 3). (*) P < 0.05, (**) P < 0.01, (****) P < 0.0001, one-way ANOVA with post-hoc Tukey test. (L–N) Immunostaining of doxycycline-induced FLAG-tagged TAZ-CAMTA1 in MS1 cells left untreated or treated with 1 µM latrunculin B (LatB) for 1 h. LatB-treated MS1 cells (45.5% ± 6.3%, n = 10) had more TAZ-CAMTA1 localized to the cytoplasm than untreated cells (5.7% ± 1.8%, n = 10). (****) P < 0.0001, unpaired t-test. (O) qPCR for expression of Cyr61 in MS1 cells without (−Dox) or with TAZ-CAMTA1 induction (+Dox), and untreated or treated with 5 µM simvastatin for 24 h. TAZ-CAMTA1-expressing cells had significantly reduced Cyr61 (untreated: 3.6 ± 0.2, n = 3, treated: 1.9 ± 0.1, n =3, [**] P < 0.01) after treatment with simvastatin. P-values were obtained by an unpaired t-test of the +Dox group treated or untreated. (P–R) Representative images showing soft agar growth of TAZ-CAMTA1-induced MS1 cells (TCiEC) in the absence or presence of 1 µM simvastatin (+Sim). Simvastatin significantly reduced the colony formation of TCiEC cells (Ctrl: 0.7 colonies ± 0.3, n = 3; TCiEC: 322.7 colonies ± 55.4, n = 3; TCiEC + Sim: 2.0 colonies ± 1.2, n = 3). (***) P < 0.001, one-way ANOVA with post-hoc Tukey test. All data are mean ± SEM. Scale bars, 25 µm.

