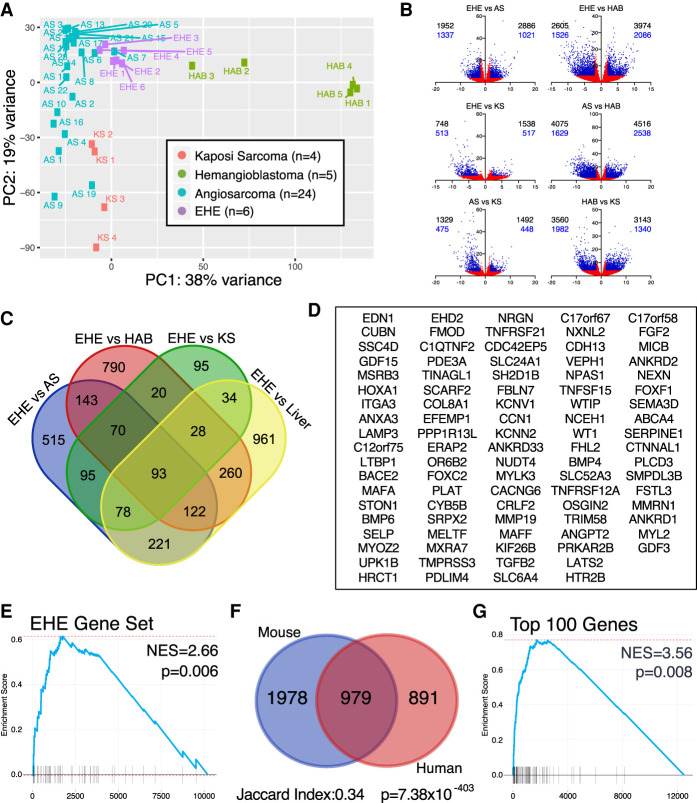
Figure 3.
Mouse EHE recapitulates the human transcriptional targets. (A) Principal component analysis of endothelial tumors via pairwise comparisons in DESeq2. (B) Volcano plots of pairwise comparisons between endothelial tumors. (Black numbers) All transcripts, (blue numbers) protein-coding genes, (blue points) log2FC ≥ 2 or log2FC ≤ −2 and FDR ≤ 0.05, (red points) −2 < log2FC < 2 or FDR > 0.05. (C) Venn diagram of genes overexpressed in EHE compared with the three other endothelial tumors and control liver; overexpressed is defined as log2FC ≥ 2 and FDR ≤ 0.05 from DESeq2. (D) Gene set of the 93 genes enriched in human EHE when compared with the three additional endothelial tumors and liver from Figure 4B. (E) GSEA shows that the EHE-specific gene set (90 mouse orthologs of the 93 EHE-specific human genes) is enriched in mouse EHE tumors. GSEA was performed on the gene set obtained after pairwise comparison of mouse EHE with control mouse livers. (NES) Normalized enrichment score. (F) Venn diagram showing the overlap of overexpressed genes in mouse and human EHE tumors compared with their control liver samples. Overexpression cutoff is defined as log2FC ≥ 2 and FDR ≤ 0.05. Jaccard index and hypergeometric P-values for enrichment are listed. (G) GSEA of mouse EHE transcripts in comparison with control mouse liver for the top 100 most overexpressed genes in human EHE in comparison with control human livers. (NES) Normalized enrichment score.

