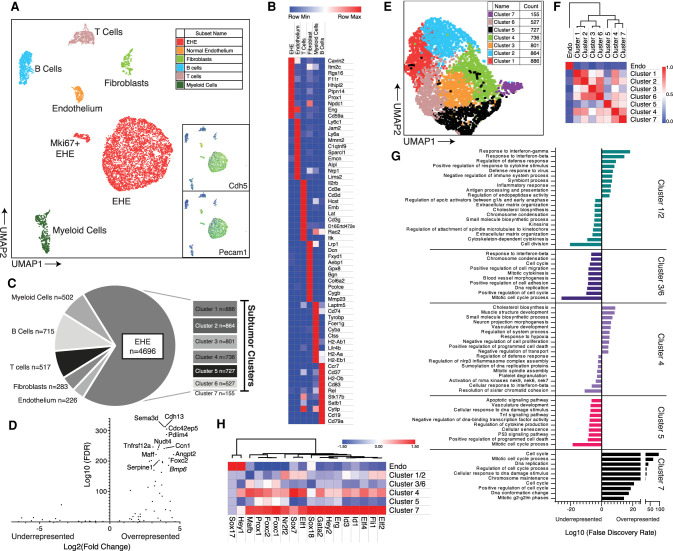
Figure 5.
Single-cell RNA sequencing of mouse EHE. (A) 2D UMAP plot of cells of filtered cells with cell population annotations. Insets demonstrate expression of Cdh5 and Pecam1. Color scale: high to low is shown by red to orange to yellow to green to blue. (B) Gene expression heat map of the top 10 most overexpressed genes from each group ranked by FDR values. Color key is listed above. (C) Pie chart of annotated cell populations with corresponding counts. The breakout chart shows counts of each of the individual tumor clusters as identified in E. (D) Volcano plot of EHE-defining genes from Figure 3D in EHE tumor cells. The top overenriched cell targets are labeled. (E) 2D UMAP plot of EHE cells in a tumor subgroup analysis, color-coded based on Seurat cluster. (F) Highly dispersed gene-guided similarity plot with unsupervised hierarchical clustering of endothelium and the seven tumor clusters from Seurat and displayed in E. (G) Enrichment plots of the top 10 most significantly enriched pathways (gene ontology, reactome, and KEGG) based on the top 500 significantly overexpressed and underexpressed genes in each cluster by differential gene expression (iCellR). Bars pointing to the right signify enrichment in the overexpressed gene set, and bars pointing to the left signify enrichment in the underexpressed gene set. (H) Gene expression heat map of normal endothelium and the tumor clusters for known transcription factors that regulate endothelial differentiation. Genes are aligned by unsupervised hierarchical clustering with the associated dendrogram. Color key listed is above.

