Fig. 1.
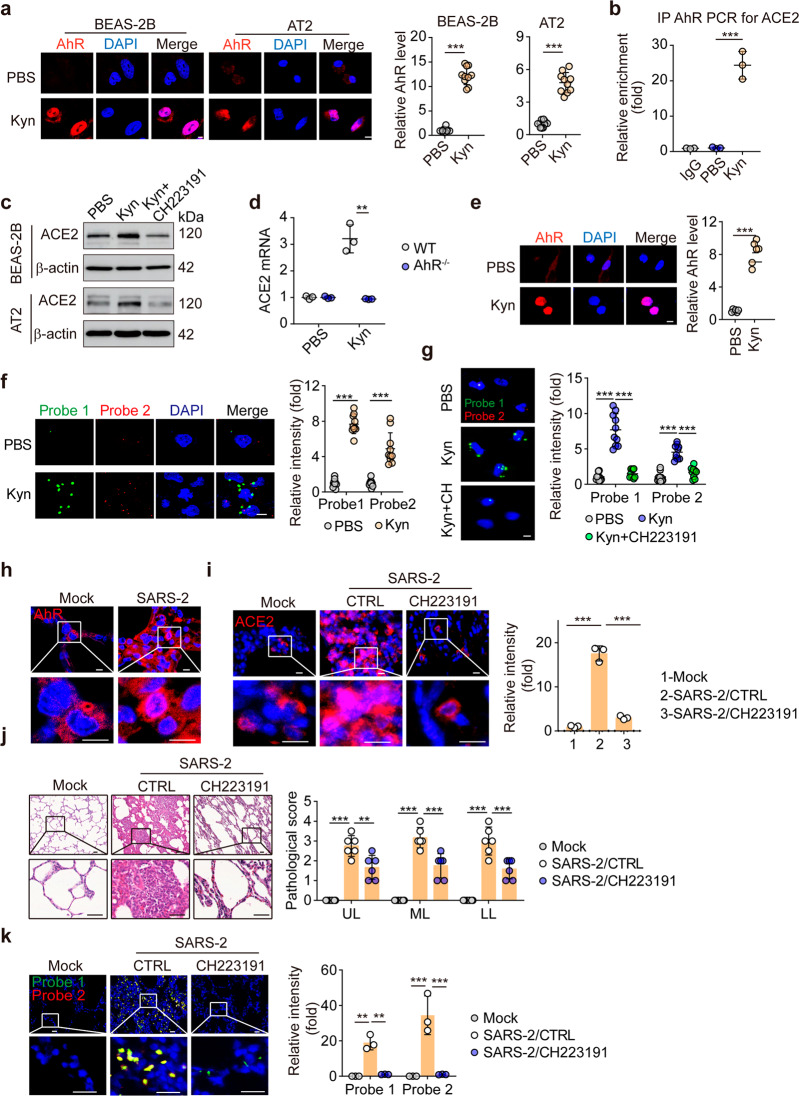
ACE2 expression is regulated by AhR. a BEAS-2B cells and primary alveolar epithelial (AT2) cells were treated with PBS or Kyn (0.4 mM) for 48 h. Cells were stained with an anti-AhR antibody and observed under a confocal microscope. Relative AhR expression was calculated from 10 fields per section. Scale bar, 10 μm. b The same as a, except that BEAS-2B cells were subjected to ChIP-qPCR with the anti-AhR antibody. c BEAS-2B cells and AT2 cells were treated with PBS, Kyn (0.4 mM) or Kyn + CH223191 (4 μM) for 48 h. ACE2 expression was determined by western blot analysis. d AT2 cells isolated from WT or AhR−/− mice were stimulated with Kyn (0.4 mM) for 24 h. ACE2 expression was analyzed by real-time PCR. e ICR mice were treated with PBS or Kyn (10 mg/kg) via intratracheal administration once a day for 3 days. Isolated alveolar epithelial cells were stained with the anti-AhR antibody. Scale bar, 10 μm. f BEAS-2B cells were pretreated with PBS or Kyn (0.4 mM) for 48 h and were then infected with SARS-CoV-2 at a ratio of 1:1 (TCID50:cells) for 48 h. Cells were fixed for RNAscope analysis with SARS-CoV-2-specific probes. The relative intensity was calculated from 10 fields per section. Probe 1 targets the viral sense sequence to evaluate viral distribution (green color); probe 2 targets the viral antisense sequence to indicate viral replication (red color). Scale bar, 10 μm. g The same as f, except that cells were pretreated with Kyn (0.4 mM) or Kyn + CH223191(4 μM). Scale bar, 10 μm. h Macaques were infected with SARS-CoV-2 for 7 days. Lung tissues were stained with the anti-AhR antibody. Scale bar, 10 μm. i–k Macaques were infected with SARS-CoV-2 and were then treated with vehicle control (CTRL) or CH223191 (1 mg/kg, i.v.) for 7 days. Lung tissues were fixed for staining with the anti-ACE2 antibody (i), H&E staining (j), and RNAscope analysis (k). Three sections from each lung lobe were evaluated per macaque. The representative image shows the viral distribution in damaged lung tissues. Scale bar, 10 μm in i, 50 μm in j, and 20 μm in k. The data are presented as the mean ± SD values. **p < 0.01, ***p < 0.001 by two-tailed t test (a, d, f) or one-way ANOVA (b, g, i–k)

