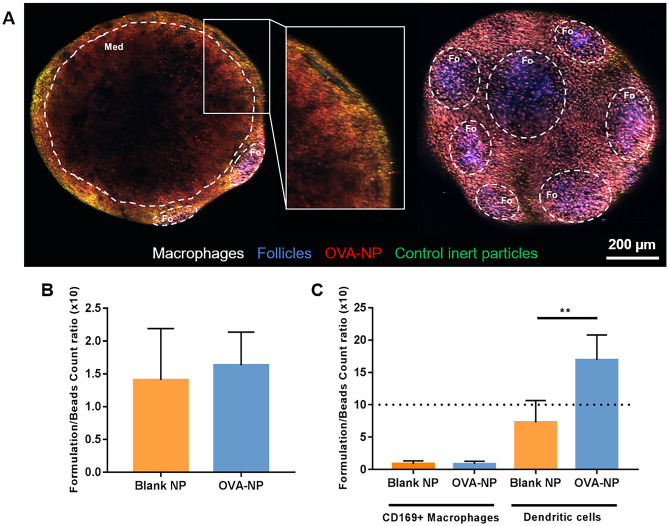
Fig. 4.
Distribution of CS:CMβG nanoparticles (blank or loaded with ovalbumin, OVA-NP) in popliteal LN, after subcutaneous injection. Ex vivo, 2-photon microscopy images a show the accumulation of OVA-loaded nanoparticles in the medullary (left) and follicular (right) areas of popliteal LN. A detail of the medullary region, with a follicle in the back, is seen in the middle image. Macrophages are shown in white (CD169-AF 647), follicles in blue (CD21/35-PB), nanoparticles in red (TAMRA) and control polystyrene beads in green (Firefli™ Fluorescent Green). Images of the separate channels for each of the images (medullary and follicular views) can be seen in Fig. S4 (supplementary materials). Fluorescence intensity was quantified by flow cytometry, in the total number of cells of the LN b and in two cell populations, macrophages and dendritic cells c. Results were normalized using the signal obtained for fluorescent polystyrene beads co-administered with the nanosystems (dot line represents equal accumulation of nanocapsules and beads). **p < 0.01

