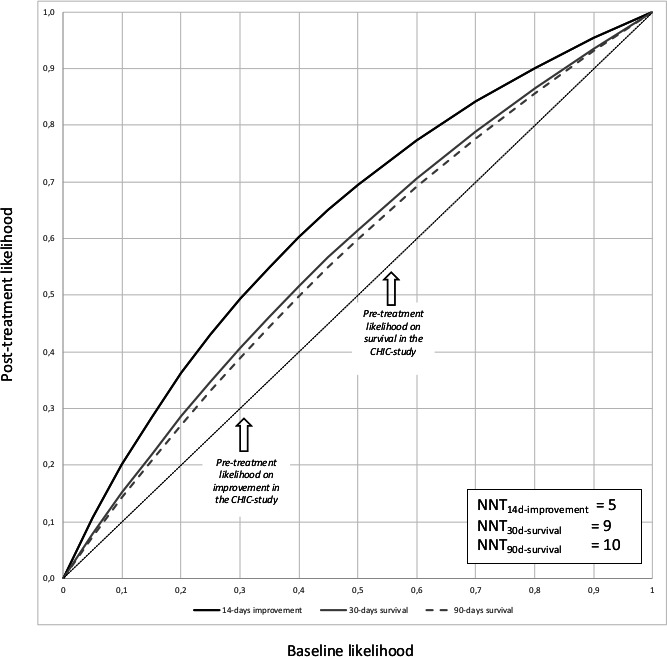
Figure 2.

Probability curves for the post-treatment likelihood of clinical improvement and survival, plotted against different (virtual) pretreatment likelihoods. Post-treatment likelihood is the product of prior likelihood (expressed as odds) and OR for the natural indirect effects (ORNIE), as determined in table 2. The diagonal reflects the situation of zero treatment effect. Curves above the diagonal reflect a beneficial effect on outcome (Y) by treatment (do(X)=1). Pretreatment likelihood for 14-day clinical improvement, 30-day survival and 90-day survival, as observed in period 1 of the CHIC study, is marked with arrows in the figure. The number needed to treat (NNT) was calculated for these rates actually observed in the CHIC study by taking the reciprocal of the difference between pretreatment and post-treatment likelihood (NNT=1/absolute risk reduction). CHIC, COVID-19 High-intensity Immunosuppression in Cytokine storm syndrome.
