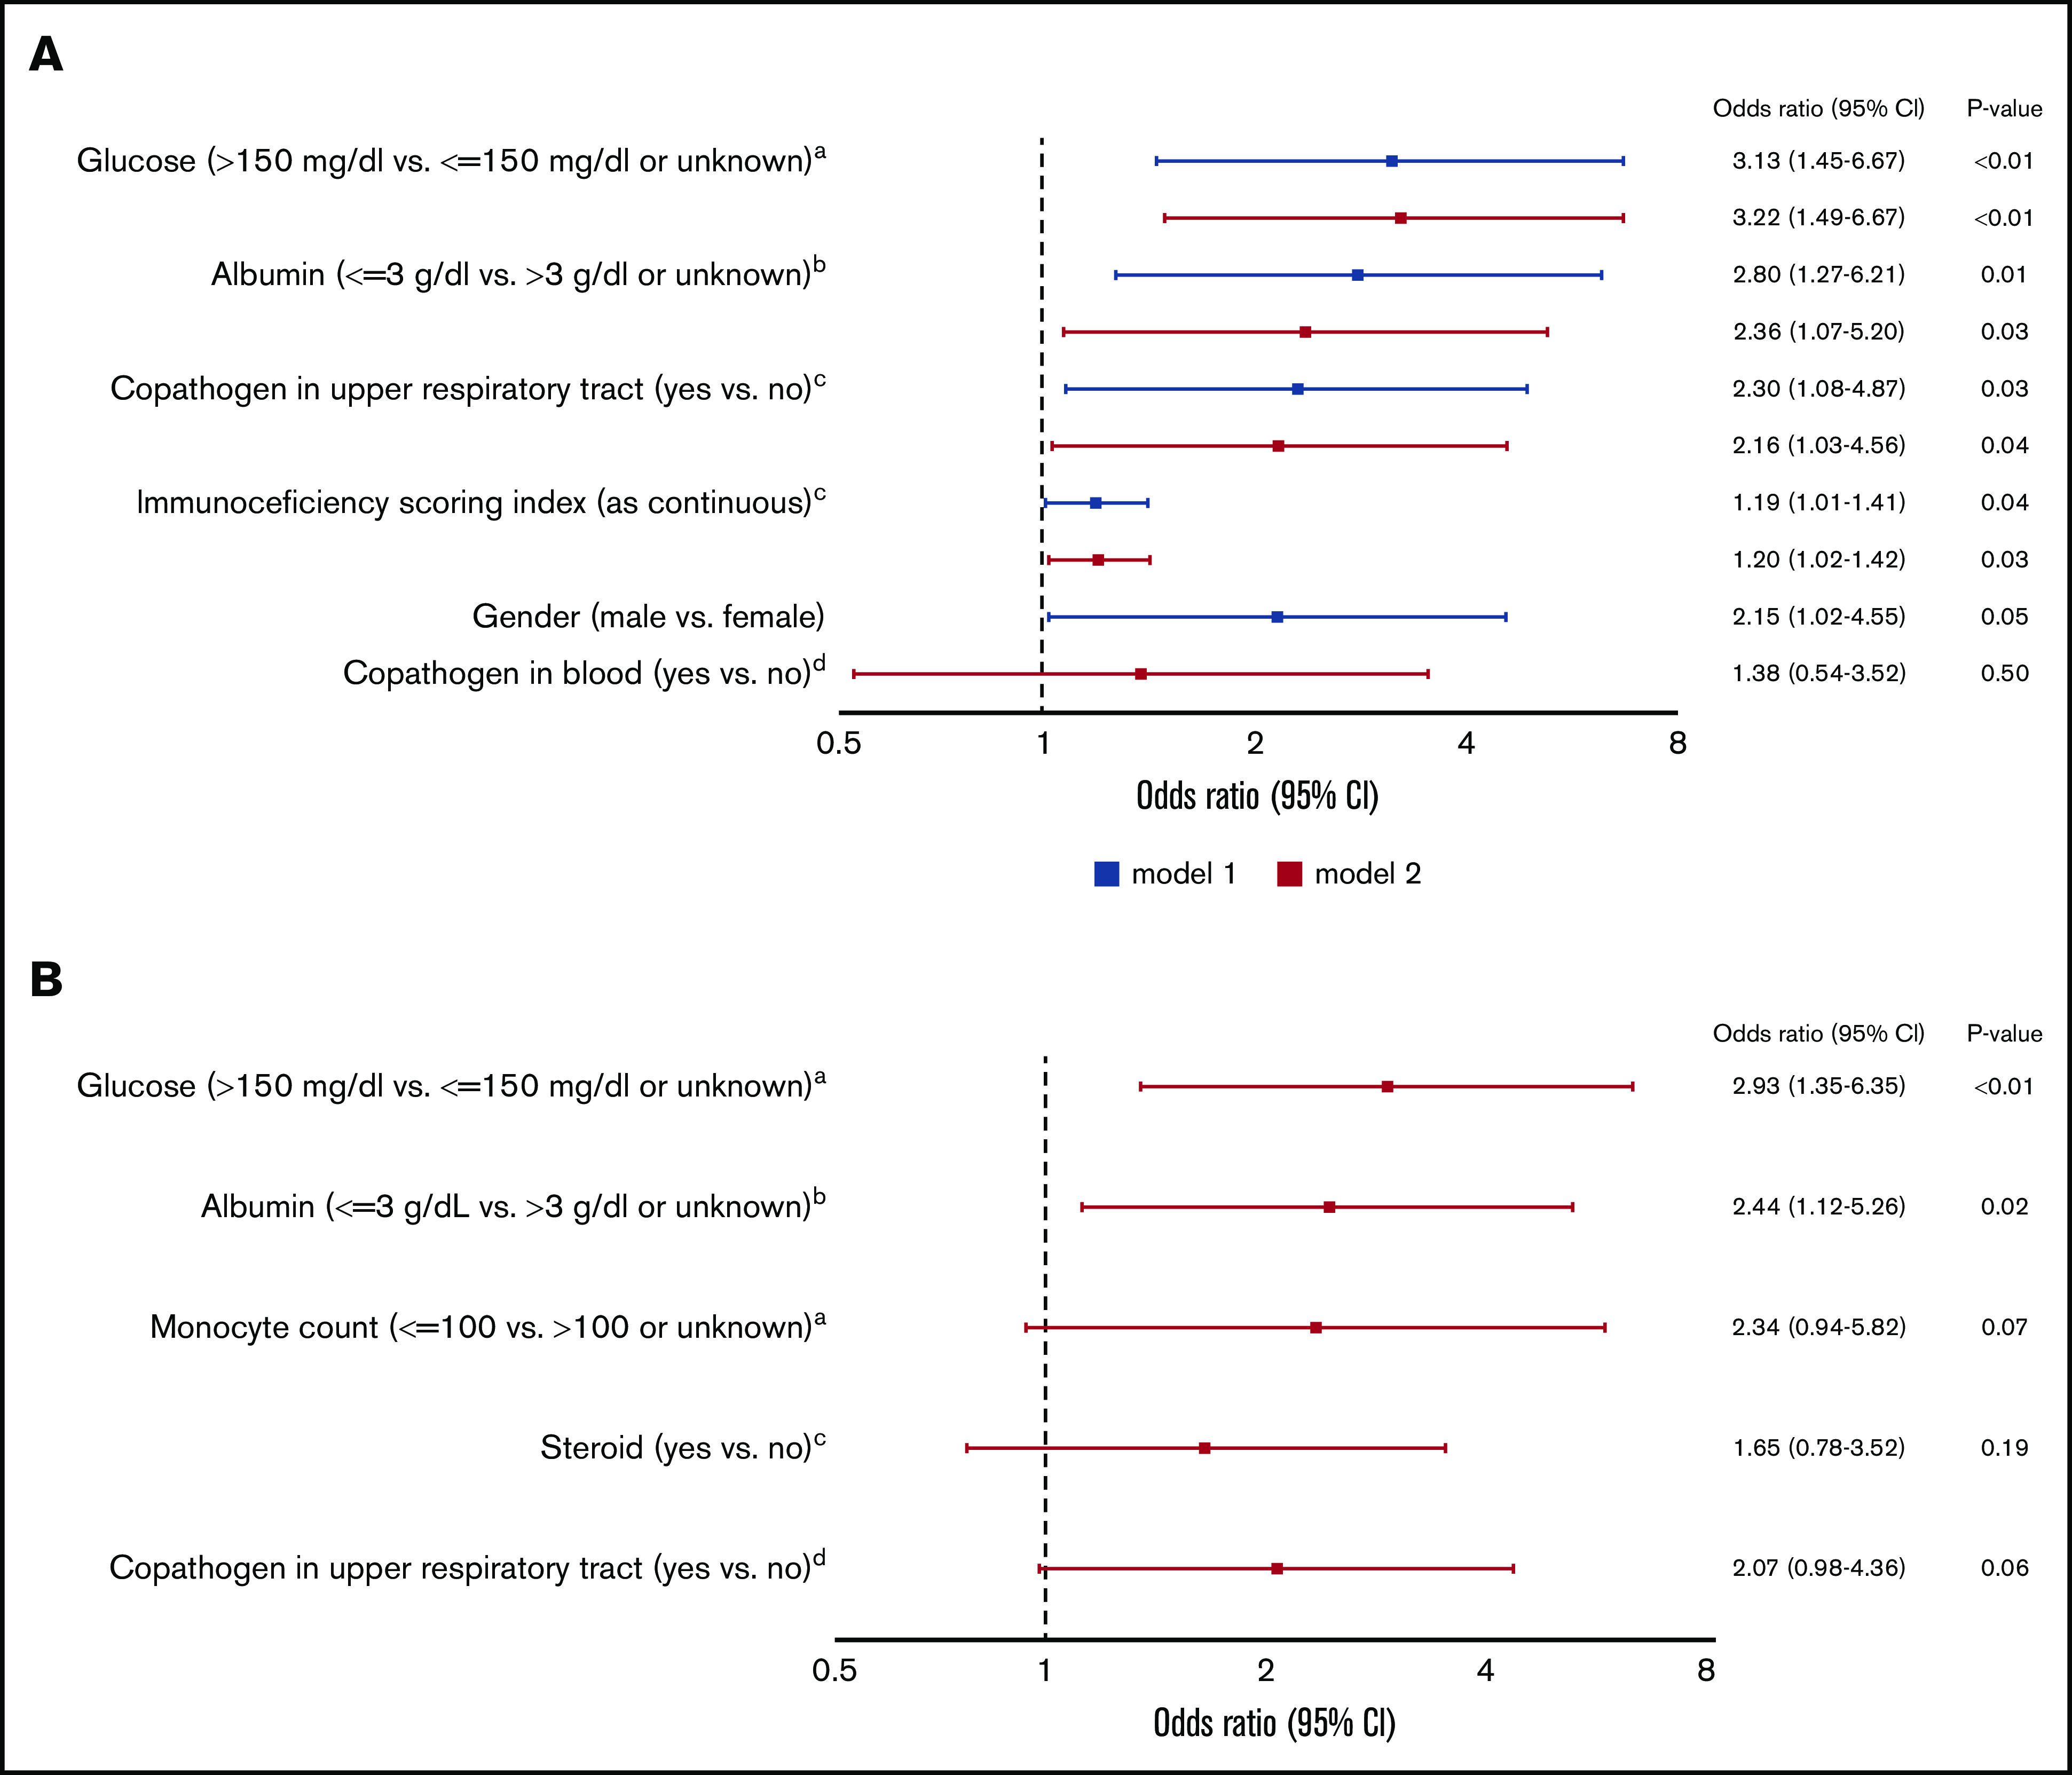
Figure 1.

Multivariable logistic regression models for occurrence of HCoV LRTI among 297 patients with first HCoV infection (43 outcome events). (A) Models including ISI. aNearest value within 2 weeks before HCoV diagnosis. bLowest albumin level in the 2 weeks before HCoV diagnosis. cAt HCoV diagnosis. dA pathogen or antigen detected in a blood within 2 days of HCoV diagnosis. (B) Models including steroid use and monocyte count instead of ISI. aNearest value within 2 weeks before HCoV diagnosis. bLowest albumin level in the 2 weeks before HCoV diagnosis. cHighest daily steroid dose in the 2 weeks before HCoV diagnosis. dAt HCoV diagnosis. CI, confidence interval; OR, odds ratio.
