
Figure 4.
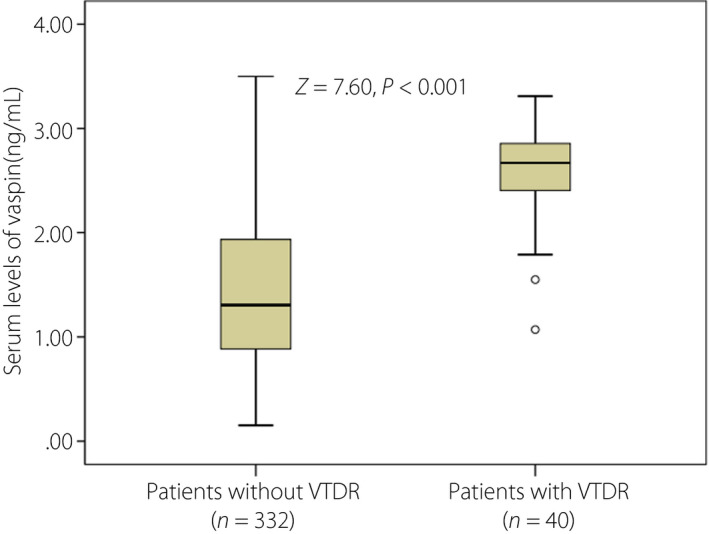
Box plots of serum levels of vaspin in type 2 diabetes mellitus patients with vision‐threatening diabetic retinopathy (VTDR) and without VTDR. Mann–Whitney U‐test. All data are medians and interquartile ranges.
Official websites use .gov
A
.gov website belongs to an official
government organization in the United States.
Secure .gov websites use HTTPS
A lock (
) or https:// means you've safely
connected to the .gov website. Share sensitive
information only on official, secure websites.
Box plots of serum levels of vaspin in type 2 diabetes mellitus patients with vision‐threatening diabetic retinopathy (VTDR) and without VTDR. Mann–Whitney U‐test. All data are medians and interquartile ranges.