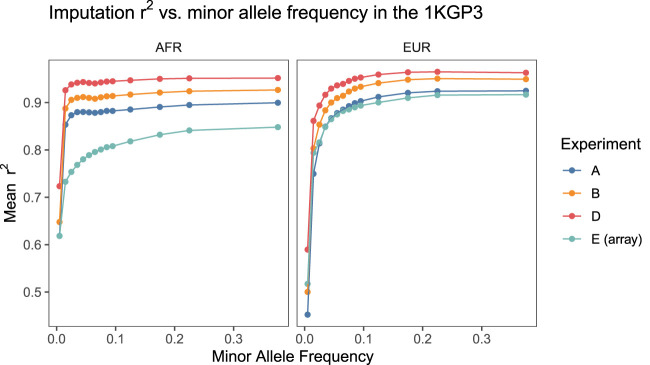
Figure 3.
Comparison of imputation quality across experiments for each superpopulation. Variants were binned according to their minor allele frequency in the 1KGP3 and imputation r2 averaged across variants in each bin. For all experiments, the 1KGP3 genotypes were treated as “truth” and imputation r2 was computed by taking the squared correlation coefficient between the vector of imputed alternate allelic dosages and the truth genotypes. Same results on a log scale are shown in Supplemental Figure 13. Note that imputation performance at low MAF for a given sequencing experiment was often higher in the AFR cohort compared to the EUR cohort.

