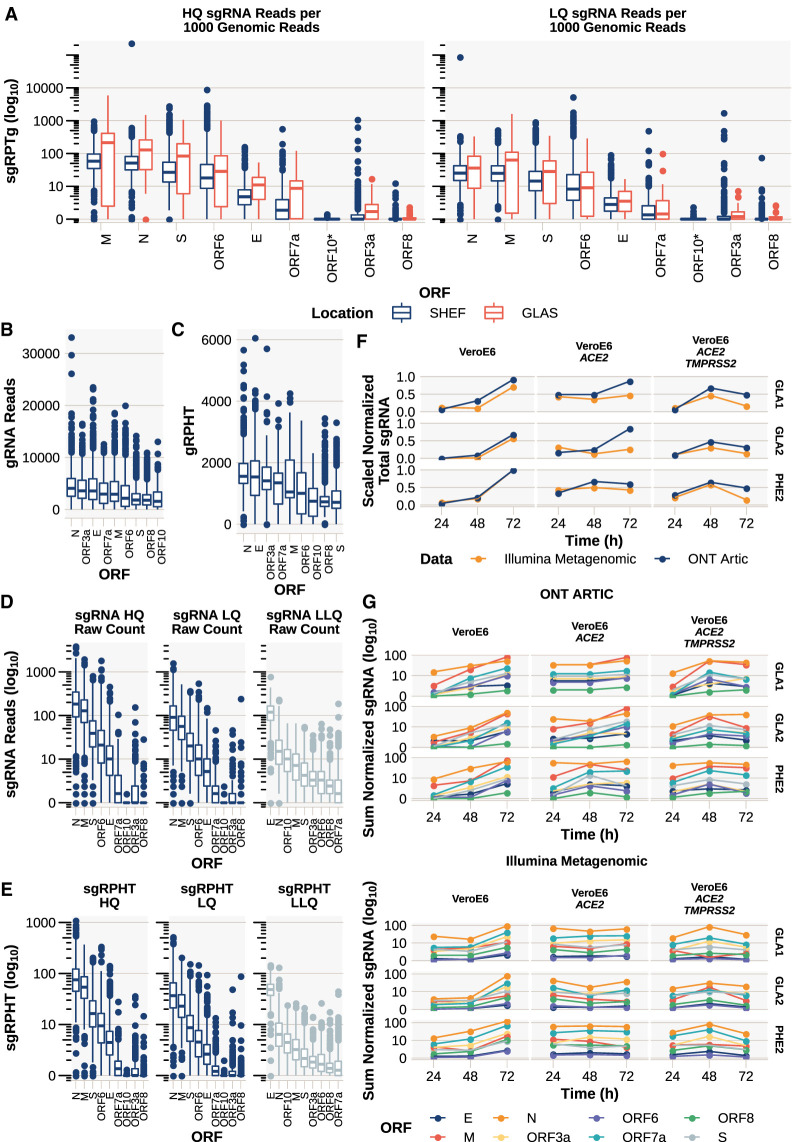
Figure 2.
In vivo and in vitro detection and quantification of canonical sgRNA in SARS-CoV-2. (A) The abundance of sgRNA detected for each ORF normalized per 1000 gRNAs from Oxford Nanopore Technologies (ONT) ARTIC data from both Sheffield (n = 1155) (Supplemental File S1) and Glasgow (n = 55) (Supplemental File S7). (sgRPTg) sgRNA reads per 1000 gRNA reads. Ordered by median. See Supplemental Figure S3 for ORF10 investigation. (B) Number of reads supporting gRNA at each ORF. If multiple amplicons cover the ORF, then this represents the sum of reads for those amplicons. (C) gRNA reads normalized per 100,000 mapped reads (gRPHT) at each ORF. (D) Raw counts of sgRNAs. (E) sgRNA normalized to total mapped reads. (sgRPHT) sgRNA reads per 100,000 mapped reads. (F,G) In vitro infection time course with three SARS-CoV-2 viral isolates (GLA1, GLA2, and PHE2) in either VeroE6 cells, VeroE6 expressing ACE2, or VeroE6 expressing ACE2 and TMPRSS2, with total RNA collected and sequenced at 24, 48, and 72 h after infection, sequenced using either ONT ARTIC (Supplemental File S6) or Illumina Metagenomic approaches (Supplemental File S5). (F) The sum of all normalized (to total mapped reads to allow direct comparison across ONT ARTIC and Illumina Metagenomic methods) sgRNA in each technology scaled to one. (G) Normalized quantity (to total mapped reads) of each canonical sgRNA in each technology. (Top) ONT ARTIC; (bottom) Illumina Metagenomic.

