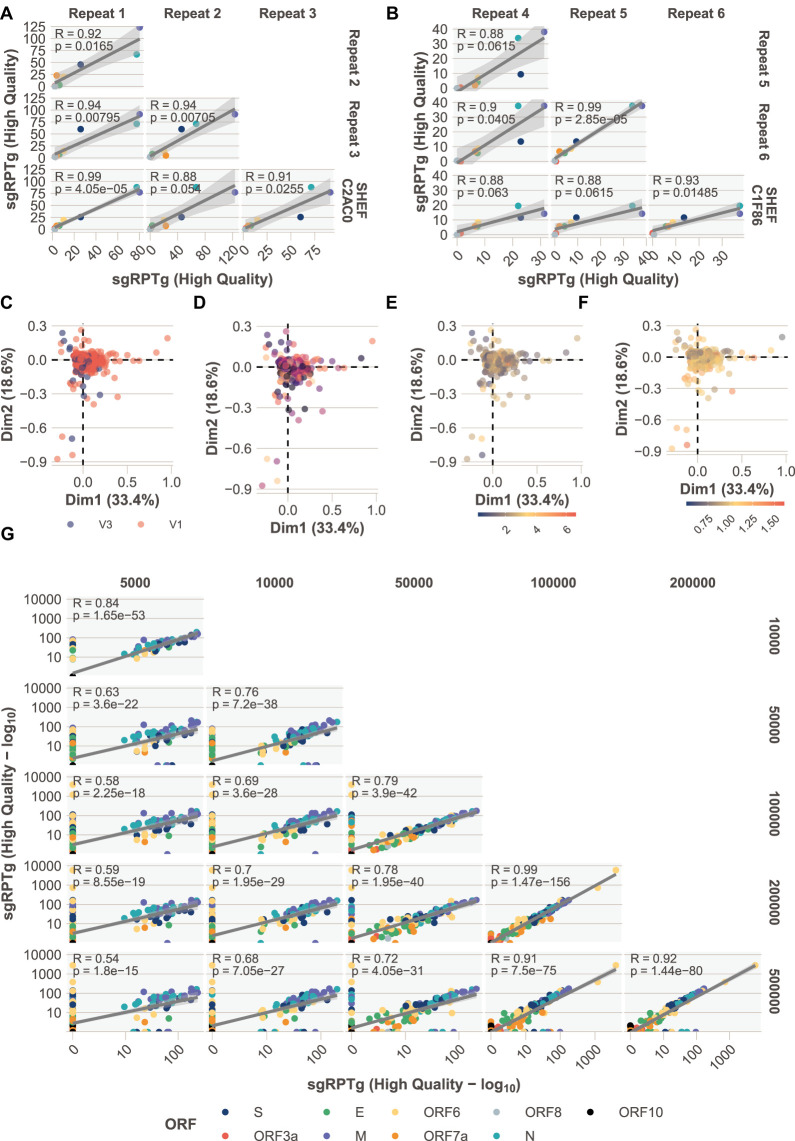
Figure 3.
Technical replicates, detection limit, and batch effects. (A,B) Four technical replicates of two samples additional to the Sheffield cohort (Supplemental File S4). Pearson correlation coefficients between sgRPTg P-values adjusted with Bonferroni correction. (ORFs colored according to legend in G.) (C–F) Unsupervised principal component analysis (Supplemental File S8) colored by ARTIC primer version V1 or V3 (C), sequencing run (D) where the color denotes a different run, total mapped read count (scale = 100,000 reads; E), or normalized E gene cycle threshold (Ct) value (F). (G) Downsampling of reads from 23 high-coverage (more than 1 million mapped reads) (Supplemental File S3) samples. The number of reads provided as input to periscope was downsampled with seqtk to 5, 10, 50, 100, 200, and 500 thousand reads.

