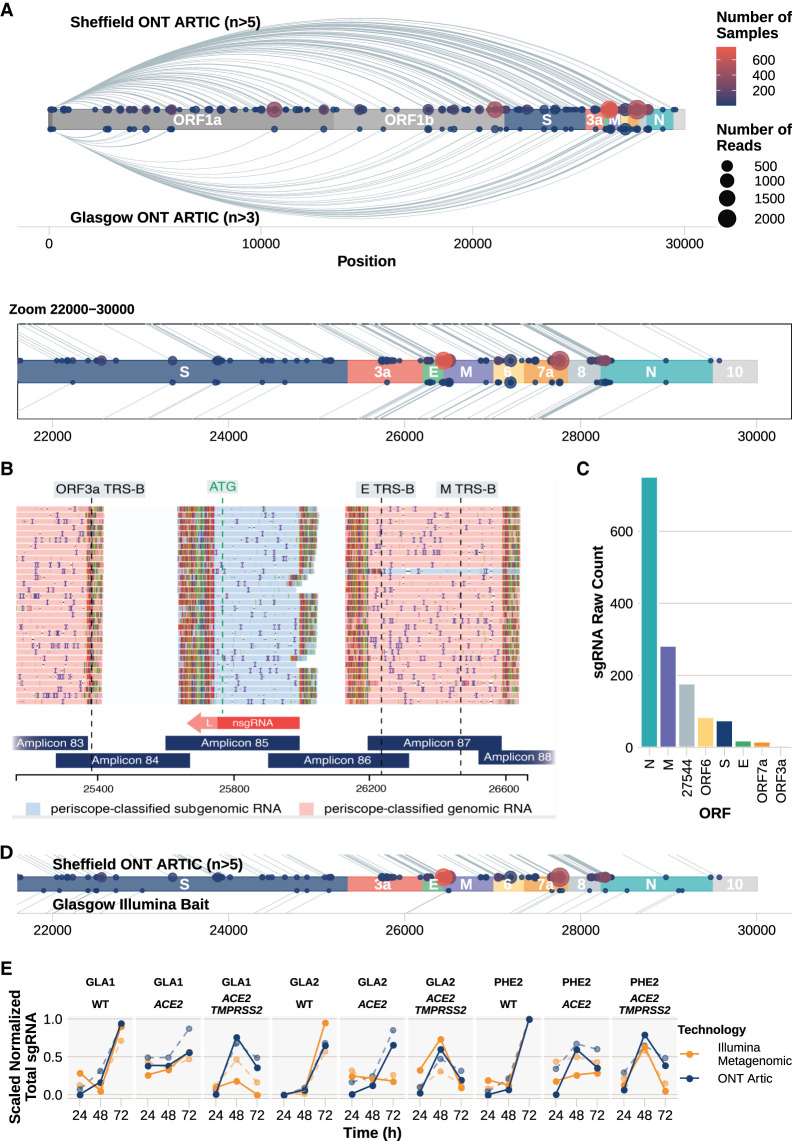
Figure 4.
Noncanonical sgRNA. We classified reads as supporting noncanonical sgRNA as described in Figure 1D (Supplemental File S2). (A) Plot showing the number of samples with each noncanonical sgRNA detected in the ARTIC Nanopore data. Size of the point represents the number of reads, and the color indicates the number of samples in which noncanonical sgRNA was found. Lines connecting points represent the sgRNA product of discontinuous transcription. Those detected in Sheffield samples are above the genome schematic; in Glasgow, below. (Inset) Zoomed-in region between nucleotides 22,000 and 30,000. (B) Noncanonical sgRNA with strong support in SHEF-C0118 at position 25,744. (C) Raw sgRNA levels (HQ and LQ) in SHEF-C0118 show high relative amounts of this noncanonical sgRNA at position 25,744. (D) Zoomed-in region between nucleotides 22,000 and 30,000 of the SARS-Cov-2 genome, showing noncanonical sgRNA in the Sheffield ONT data set (top) compared with the noncanonical sgRNA detected in the Illumina bait capture data from Glasgow (Supplemental File S11). (E) Noncanonical sgRNA levels (solid lines) compared with canonical (dashed lines) in an in vitro model of SARS-CoV-2 infection measured with both Illumina metagenomic sequencing (orange) and ONT Artic (blue). Total sgRNA levels are normalized per 100,000 mapped reads and scaled within each data set for comparison.

