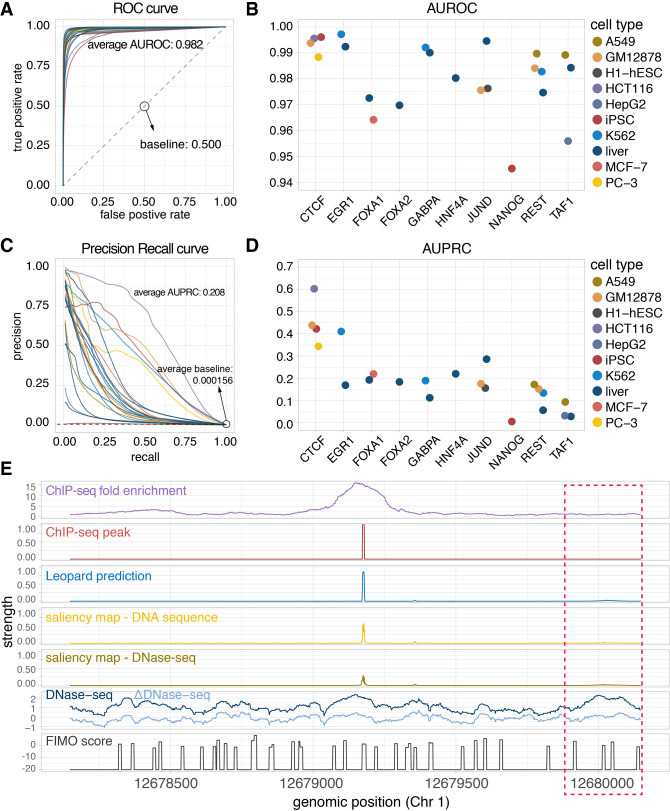
Figure 2.
Leopard identifies cell type–specific transcription factor binding events at single-nucleotide resolution. (A) The receiver operating characteristic (ROC) curves and (B) the areas under receiver operating characteristic curves (AUROCs) of the 23 testing TF–cell type pairs. Each dot represents the overall AUROC calculated from the testing chromosomes (Chr 1, Chr 8, and Chr 21). Different colors represent different cell types. (C) The precision recall (PR) curves and (D) areas under the precision recall curves (AUPRCs) of the 23 testing TF–cell type pairs. The average AUPRC baseline score of random prediction is 0.000156, shown as the horizontal dashed line, corresponding to the number of TF binding sites over the total number of base pairs in the testing chromosomes (Chr 1, Chr 8, and Chr 21). (E) An example 2000-bp segment is given to show the prediction results. This segment contains signals between genomic positions 12,678,147 and 12,680,147 of Chr 1 from the JUND binding profile in the liver cell. The first row is the original ChIP-seq fold enrichment generated through the standard ENCODE analysis pipeline. The second row is the high-resolution ChIP-seq peak created by the GEM peak finder. In the third row, Leopard generates single-nucleotide predictions and precisely provides the binding sites. The two saliency maps of DNA sequence and DNase-seq indicate positions contributing to the predictions. The corresponding DNase-seq and ΔDNase-seq signals, as well as the sequence-based motif scan scores using FIMO, are also shown here for comparison. Of note, the region in the pink rectangle also has open chromatin (high DNase-seq signals) and binding motifs (high FIMO scores), but no binding events were observed from the ChIP-seq experiment. Leopard is able to detect these nonbinding locations, no prediction peaks in this region.

