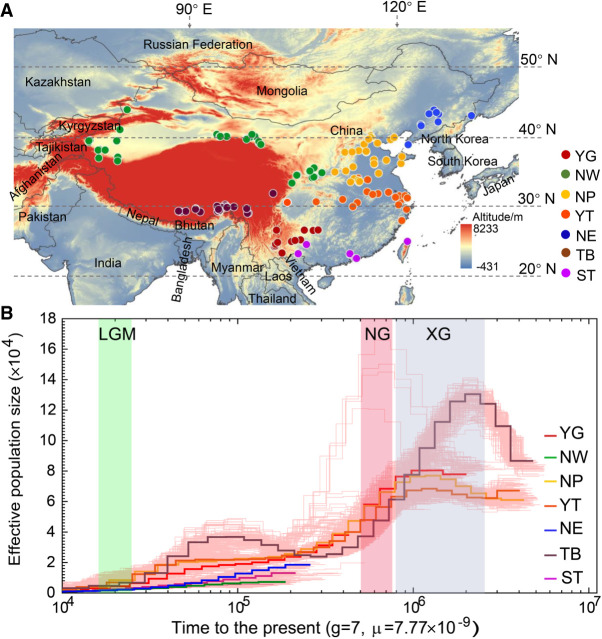
Figure 1.
Distribution of the 263 peach accessions and demographic history of the seven ecotypes. (A) Geographic distribution of 263 peach accessions used in this study. Each accession is represented by a dot on the world map. Seven ecotypes are highlighted using solid circles with different colors. (B) Demographic history of the seven peach groups. Ancestral population size was inferred using the PSMC model. Three periods, the last glacial maximum (LGM, ∼20 KYA), Naynayxungla Glaciation (NG, 0.5∼0.78 MYA), and Xixiabangma Glaciation (XG, 0.8∼0.17 MYA), are shaded in green, red, and blue, respectively.

