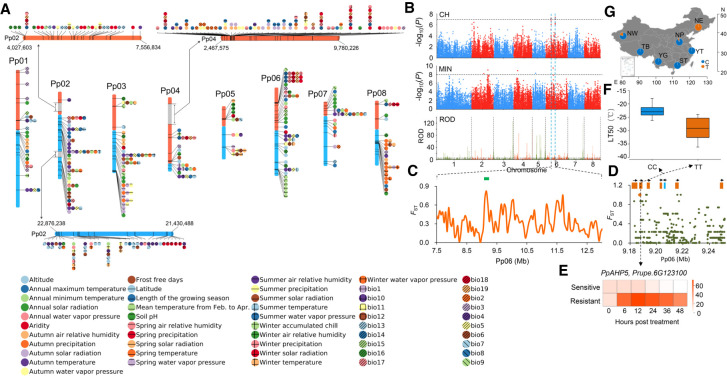
Figure 3.
Genome-wide environmental association studies of 51 environmental variables and genomic loci associated with winter cold adaptation. (A) SNPs associated with environmental variables (EVs). Only the top 10 association signals for each EV are shown. All signals were included if the total number of signals was <10. Three EV association hotspots are highlighted using gray rectangles, and zoom-in figures for these hotspots are displayed. (B) The PpAHP5 locus involved in adaptation to winter low temperature in peach. Manhattan plots for a GWAS study of cold hardiness (CH) and winter lowest temperature (MIN), and selection signals of the NE group are presented. The horizontal dashed lines represent the significance threshold for each test. The candidate genomic region is highlighted between two dashed blue vertical lines. (C) Distribution of FST values between NE and ST groups in the candidate region. The green bar indicates the PpAHP5 locus. (D) Close-up view of the FST values in a region corresponding to the green bar in C. This region contains six PpAHP homologs (orange) and one other gene (light blue). The candidate SNP is highlighted using an orange dot. (E) Relative expression changes of PpAHP5 after cold treatment (−28°C) in resistant and sensitive cultivars. (F) Associations between genotypes (CC or TT) of locus Pp06: 9,187,362 and cold hardiness (lethal temperature of 50%, LT50). (G) Allele (C or T) frequencies of association locus (Pp06: 9,187,362) in PpAHP5 across the seven groups.

