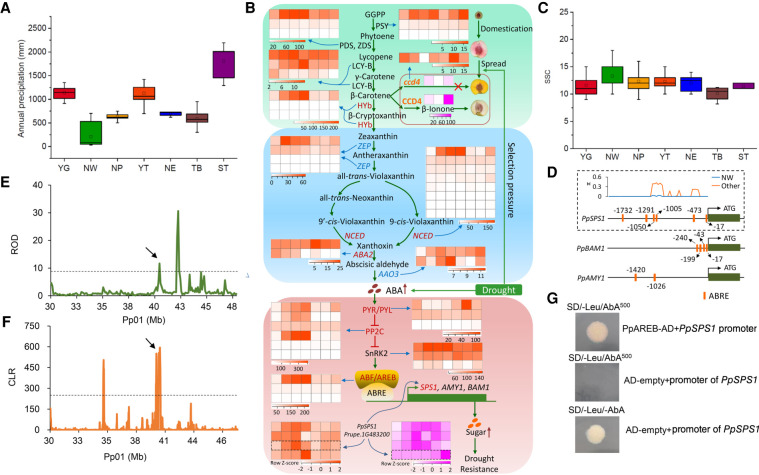
Figure 4.
Genetic basis of drought resistance and high sugar content in the NW group. (A) Annual precipitation among geographic regions of the seven groups. (B) Relationship between the ABA pathway, drought stress, and evolution of flesh color. Heat maps in orange indicate gene expression levels (FPKM) under drought stress (0 h, 6 h, 12 h, 24 h, 3 d, 6 d, 12 d). Heat maps in pink indicate gene expression levels (FPKM) during peach fruit development (10, 50, and 90 d post-bloom date [dpb] for PpCCD4; 20, 40, 60, 80, 100, 120 dpb for PpSPS1). Genes under selection in the NW group are highlighted in red. Red arrows indicate the increase in levels of ABA and sugars. (C) Soluble solid content (SSC) among the seven groups. (D) ABRE cis-acting elements in the promoters of PpSPS1, PpBAM1, and PpAMY1. Orange boxes indicate ABRE elements in the promoter of each gene. The number around each ABRE represents the position from the ATG. The distribution of ABRE elements and nucleotide diversity (π) in the promoter of PpSPS1 in the NW and other groups are shown in a dashed box. (E) Distribution of ROD around PpSPS1 on Chromosome 1. Black arrow points to PpSPS1. (F) Distribution of CLR values around PpSPS1 on Chromosome 1. Black arrow points to PpSPS1. (G) Verification of the interaction between PpAREB (Prupe.1G434500) and the promoter of PpSPS1 (Prupe.1G483200) using a yeast one-hybrid assay.

