Figure 6.
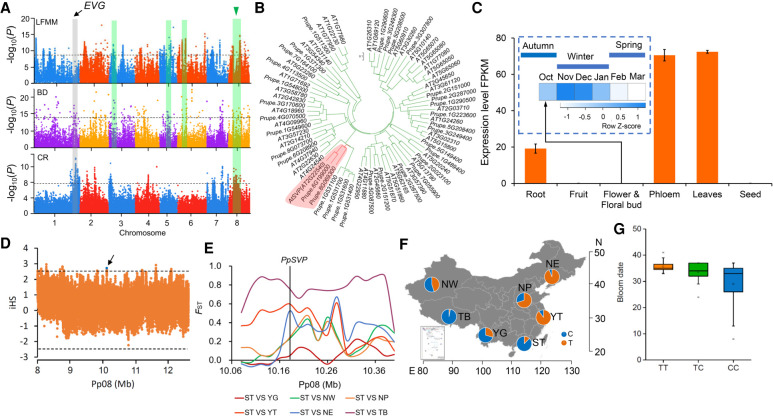
A major PpSVP locus involved in local adaptation of bloom date in peach. (A) Manhattan plots of SNPs associated with EVs (LFMM), bloom date (BD), and chilling requirement (CR). Dashed horizontal lines represent the significance thresholds for the tests. The overlapped regions between GWAS for BD and LFMM are highlighted using green shaded rectangles. The major QTL for CR and BD overlapping with local selection signals on Chromosome 8 surrounding PpSVP is indicated by a blue triangle. The EVG locus is highlighted using a gray shaded rectangle. (B) Neighbor-joining tree of PpSVP and MIKC-type MADS family genes. The clade containing PpSVP is highlighted in red. (C) Temporal and spatial expression patterns of PpSVP. Error bars represent standard deviation of three biological replicates. (D) Patterns of normalized iHS scores across the ∼4.5-Mb genomic region around PpSVP. The dashed horizontal lines represent the threshold of positive selection signal (|iHS| > 2.5). The blue dot indicates the SNP (Pp08: 10,173,576) that showed high iHS score in PpSVP. (E) FST around PpSVP among different groups. The associated SNP in PpSVP is indicated using vertical black line. (F) Allelic frequencies of the associated SNP (Pp08: 10,173,576) in PpSVP across the seven groups. C and T represent the alleles of this SNP. (G) Relationship between genotypes of associated SNP (Pp08: 10,173,576) and bloom date. TT, TC, and CC represent the three genotypes of this SNP.

