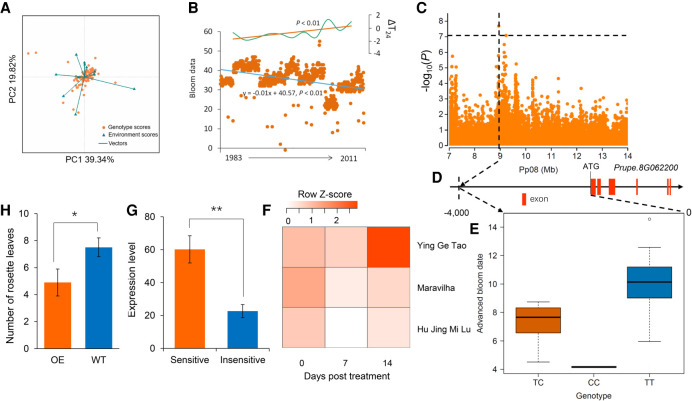
Figure 7.
Genotype–environment interaction analysis and genome-wide association study of advance in bloom date. (A) Genotype–environment interaction analysis of bloom date from 1983 to 2011 using the AMMI analysis. (B) Scatterplots of relative bloom date of 89 peach accessions from 1983 to 2011 and temperature change in the spring. The blue and orange lines represent the trend of bloom date changes and temperature changes in the spring, respectively, based on the linear regression analyses. ΔT24 indicates anomalies in the mean temperature from February to April compared to those from 1983 to 2011. (C) Regional Manhattan plot of GWAS for ABD on Chromosome 8 of the 7.0- to 14.0-Mb region. The horizontal black dashed line indicates significance threshold (P < 7.28 × 10⁻⁸ or −log10[P] > 7.08) using a Bonferroni test (0.05). (D) The most significant SNP associated with ABD and its location relative to gene PpLNK1 (Prupe.8G062200). (E) Association between genotypes of the most significant SNP and ABD. (F) Changes in PpLNK1 expression in three cultivars in a climate-warming simulation experiment. (G) Comparison of PpLNK1 expression between accessions sensitive and insensitive to global warming at blooming. (**) P < 0.01. (H) Comparison of BD between wild type (WT) and PpLNK1 overexpression (OE) A. thaliana lines. (*) P < 0.05.

