Figure 4.
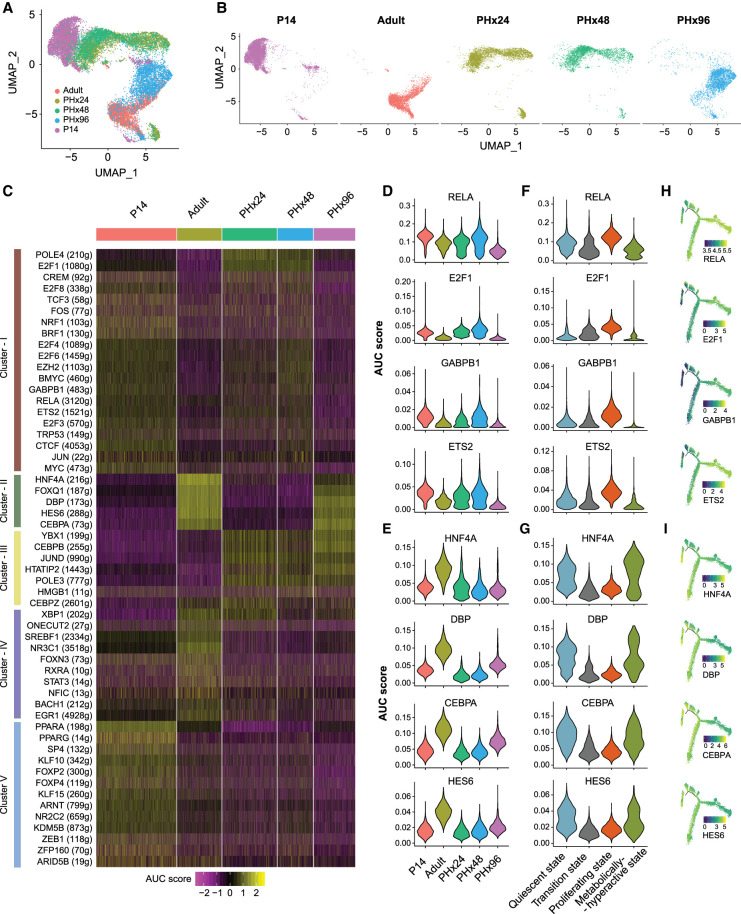
Gene regulatory networks are rewired to a postnatal-like state during regeneration. (A) UMAP projection of all hepatocytes based on the AUC scores for each regulon calculated with SCENIC. Cells are colored according to the sample of origin. (B) AUC score-based UMAP projection, grouped according to the sample of origin. Cells are colored according to sample of origin. Adult and PHx96 hepatocytes cluster together, whereas PHx24 and PHx48 hepatocytes cluster together with P14 hepatocytes. (C) Heat map depicting the activities of different regulons that show time point-dependent variations. (D) Violin plot showing distribution of AUC scores for RELA, E2F1, GABP1, and ETS2 regulons across hepatocytes from each time point demonstrating their high activity in PHx24, PHx48, and P14 hepatocytes. (E) Violin plots showing distribution of AUC scores for HNF4A, DBP, CBPA, and HES6 regulons across hepatocytes from each time point demonstrating their high activity in adult and PHx96 hepatocytes. (F) Violin plots showing distribution of AUC scores of representative regulons across hepatocytes showing their up-regulation in the proliferative state. (G) Violin plots showing distribution of AUC scores of representative regulons across hepatocytes showing their up-regulation in quiescent and metabolically active states. (H) Pseudotime plots of hepatocyte cellular trajectories colored by the AUC scores of representative regulons showing high activity in the proliferative state. (I) Pseudotime plots of hepatocyte cellular trajectories colored by the AUC scores of representative regulons showing high activity in quiescent and metabolically active states.

