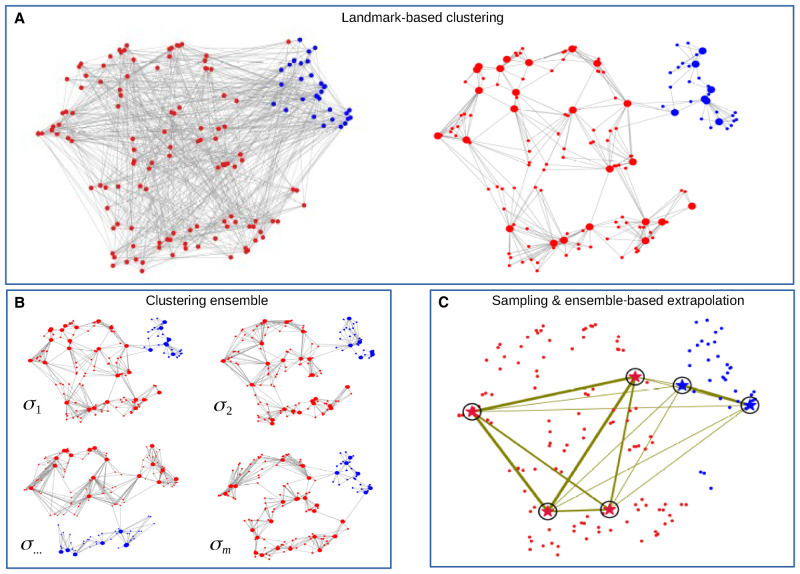
Figure 1.
Overview of Specter. Illustrations are based on t-SNE visualizations of a random subsample of scRNA-seq data by Grün et al. (2016). (A) Standard spectral clustering constructs an affinity matrix that captures (transcriptional) similarities between all pairs of cells (left), which renders its eigen decomposition prohibitively expensive for large data sets. (Right) In contrast, describing each cell (small circles) with respect to its nearby landmarks (big circles) that were initially selected as the means computed by k-means clustering, creates a sparse representation of the full data that speeds up the computation of a spectral embedding. Cells are colored to distinguish sorted hematopoetic stem cells (blue) from other mouse bone marrow cells (red) assayed by Grün et al. (2016). (B) Specter does not rely on a single set of parameters but performs multiple runs of landmark-based clustering using different sets of landmarks of different size and different measures of similarities between cells (parameterized by σ). Three clusterings closely resemble the true labeling shown in A, but one differs substantially. (C) Specter reconciles all individual clusterings into a consensus clustering. It clusters a carefully selected subset of cells (marked by circled stars) based on their co-association across all individual clusterings in B, indicated by the width of the corresponding edge. The thicker an edge, the more often its two end points were placed in the same cluster. Here, the four red stars and the two blue stars correctly form two groups of cells, whose labels are finally propagated to the remaining cells using one-nearest-neighbor classification. The final clustering shown in C closely resembles the true clustering in A.

