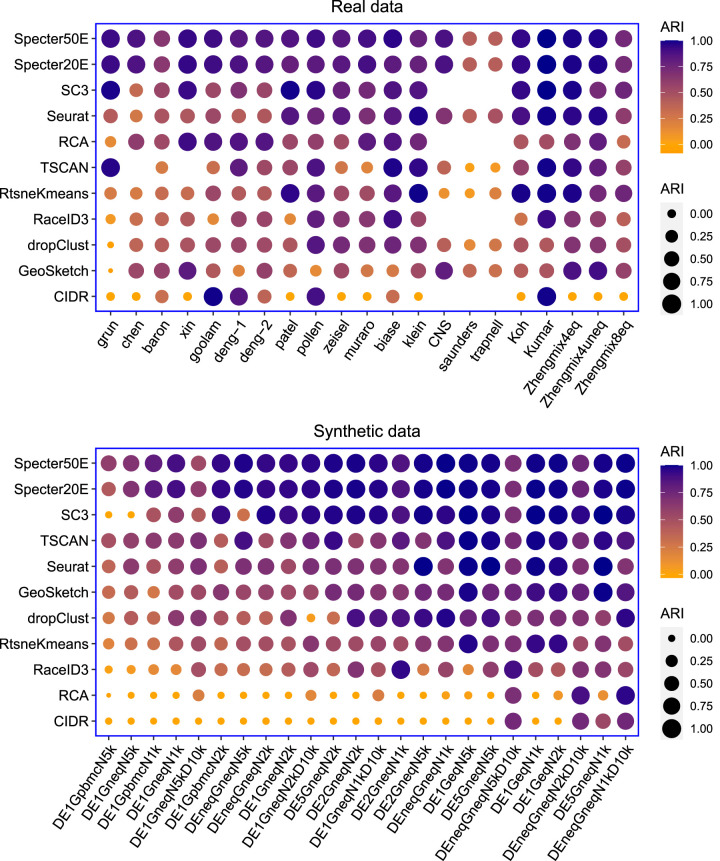
Figure 2.
Clustering performance measured in ARI of Specter and competing methods on real and synthetic scRNA-seq data sets. Methods are ordered by mean ARI score across data sets decreasing from top to bottom. In the calculation of mean scores, we excluded for each method the data sets for which the method did not run successfully. For the rightmost five real data sets, ground truth labels are based on cell phenotypes defined independently of scRNA-seq (Supplemental Table S1). Synthetic data sets are ordered from left to right by increasing mean ARI over all methods. SC3, RCA, RaceID3, and CIDR failed to run on the three largest data sets CNS, saunders, and trapnell because of insufficient memory. TSCAN failed to run on data sets chen and skin for unknown reasons. Geometric sketching refers to the Louvain clustering of 10% of the cells sampled using geometric sketching. Results for different sketch sizes are shown in Supplemental Figure S3.

