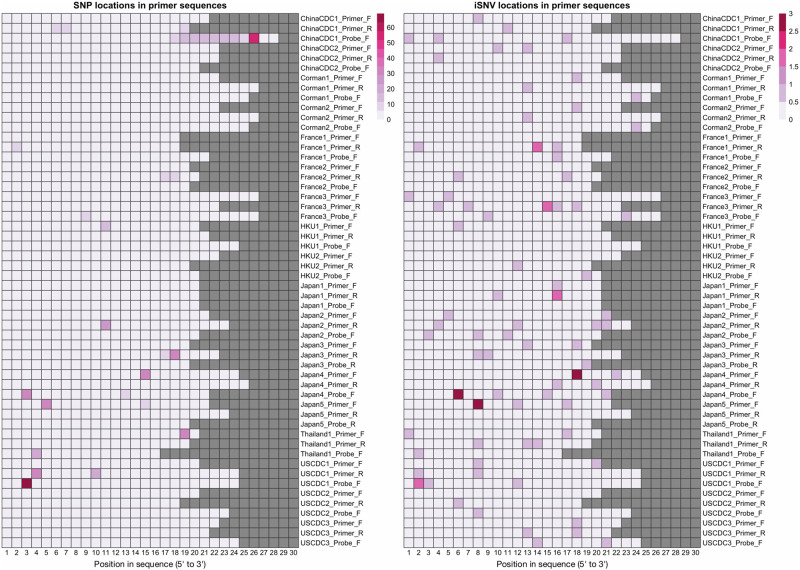
Figure 4.
iSNV and SNP presence on widely used primers and probes. This figure shows the locations on WHO probes and primers that contain SNPs (left) and iSNVs (right). Columns correspond to base pair positions within the probe, and the sequences are 5′-aligned. Rows correspond to the oligonucleotide sequences, and squares are highlighted based on how many samples/genomes contain a variant in that position.

