Figure 2.
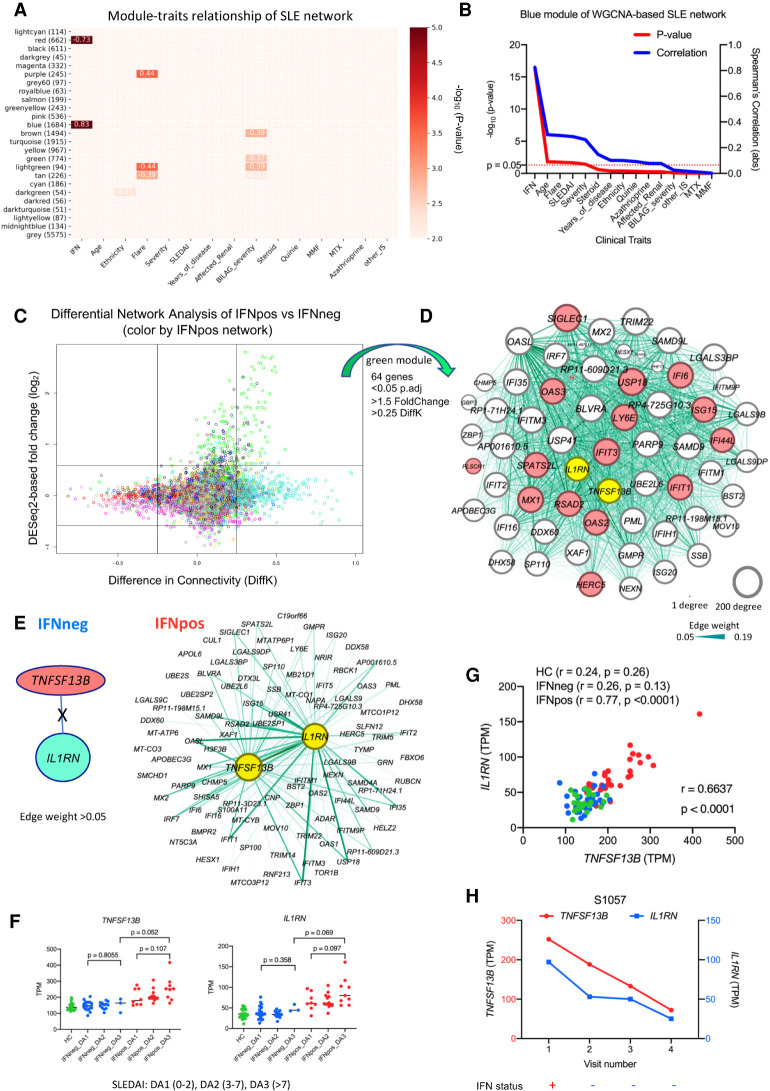
Combined analysis of differential network and gene expression of classical monocytes reveals two known immune modulators (TNFSF13B and IL1RN). (A) The module-traits correlation matrix heat map of WGCNA based on total 25 different modules and external clinical features such as assigned IFN response status, age, ethnicity, flare, severity, and other clinical parameters. The color shows significance (−log10 of P-value) of the Spearman's correlation between a trait and the module eigengene with the correlation values in each cell that corresponds to a significant correlation (P-value < 0.01). The number of genes in each module is also shown (in brackets) with the module name. IFN response status is the most correlated clinical feature, with the blue module being the top positively correlated (r = 0.83; P = 5 × 10⁻¹⁷) and the red module being the top negatively correlated (r = −0.73; P = 1 × 10⁻¹¹). (B) The line plot shows significance (−log10 of P-value on the y1-axis in red color) and Spearman's correlation (y2-axis in blue color) of different clinical traits with blue module's eigengene. The clinical traits are sorted in decreasing order of statistical significance of the correlation for the blue module. (C) The plot shows differential expression and differential connectivity of genes between IFNpos and IFNneg patients (x-axis is DiffK = K1 − K2; K1 = connectivity in IFNpos network; K2 = connectivity in IFNneg network, and y-axis is the DESeq2-based log2 fold change). Colors of genes represent different modules based on the IFNpos (Network1) network. (D) Sixty-four genes were selected from the green module using significant DEGs (P.adj < 0.05; 1.5-fold change) as well as DCGs (|DiffK| > 0.25) and visualized by Gephi, where nodes are sized according to the number of edges (connections) and the edge thickness is proportional to the strength of coexpression. Available IFN signature genes (IFN-20) are highlighted in red colors, and two known immune modulators (IL1RN and TNFSF13B [BAFF]) are highlighted in yellow. (E) An example showing the importance of differential network analysis because IL1RN and TNFSF13B, which are in same green module, have a large number of connected genes in the IFNpos network but no connected genes (at a threshold of 0.05 edge weight) in the IFNneg network. The strength of coexpression is also varying and is presented by the width of the connection. TNFSF13B and IL1RN are in different modules (salmon and turquoise, respectively) in the IFNneg network. (F) Expression of TNFSF13B and IL1RN is plotted according to IFN response status and SLEDAI class (DA1, DA2, or DA3). Green, blue, and red colors represent HC, IFNneg, and IFNpos, respectively. The provided P-values are calculated using an unpaired t-test (two-tailed). (G) The Spearman's correlation between TNFSF13B and IL1RN expression (TPM) for HC, IFNneg, and IFNpos group as well as the whole cohort (r = 0.6637; P < 0.0001). (H) Gene expression changes for TNFSF13B and IL1RN in longitudinal data from patient S1057, where genes are plotted on different y-axes; TNFSF13B on y1-axis in red and IL1RN on y2-axis in blue. The lower panel of this plot shows corresponding IFN response status over multiple longitudinal visits.

