Figure 3.
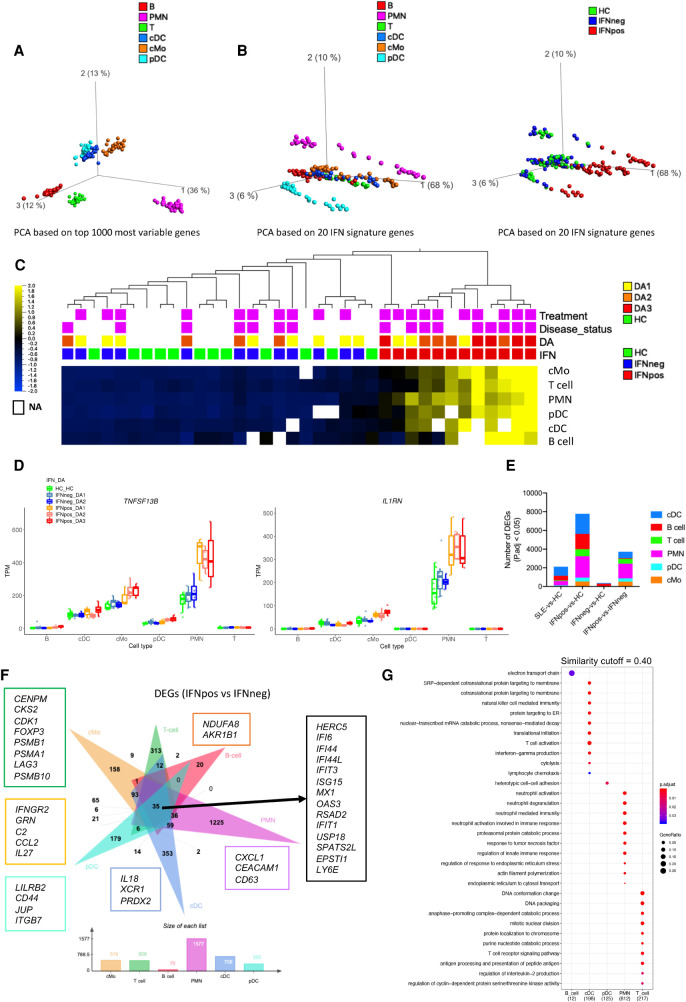
IFN response signature is present in all immune cell types. (A) PCA plot based on 1000 most variable genes across six different immune cell types represented by different colors. (B) PCA plots of different cell types based on IFN signature genes (IFN-20) colored either by cell types (left) or by IFN response status (right). (C) Average expression of IFN-20 genes clustered based on hierarchical clustering and presented as row-wise z-scores of TPM in IFNpos (red), IFNneg (blue), and HC (green) for each cell type separately. The DA panel shows disease activity categories determined by SLEDAI score. Patients with active disease at the time of visit and those taking treatments are highlighted in purple color. The detailed expression heat map with each one of the IFN-20 genes in all six cell types is provided in Supplemental Figure S5G. (D) Gene expression of TNFSF13B and IL1RN across six different cell types using IFN response status and SLEDAI-based categories. (E) A stacked column plot shows the number of RNA-seq-based differentially expressed genes with an adjusted P value threshold of 0.05 (Benjamini–Hochberg correction on DESeq2 P-values) in multiple cell type–specific data sets and different comparisons. (F) The flower plot (generated by jvenn [Bardou et al. 2014]) shows the overlap of DEGs from the IFNpos versus IFNneg comparison (Benjamini–Hochberg correction on DESeq2 P-values) in six different cell types. Some cell-specific genes of interest are highlighted in boxes with outline colors matching the color used for the relevant cell type. (G) Functional annotations (generated by clusterProfiler) of cell-specific DEGs from F. We used a similarity cutoff of 0.40 to remove similar Gene Ontology terms. The color shows the significance (in terms of P.adj) and the size is gene ratio of annotations.

