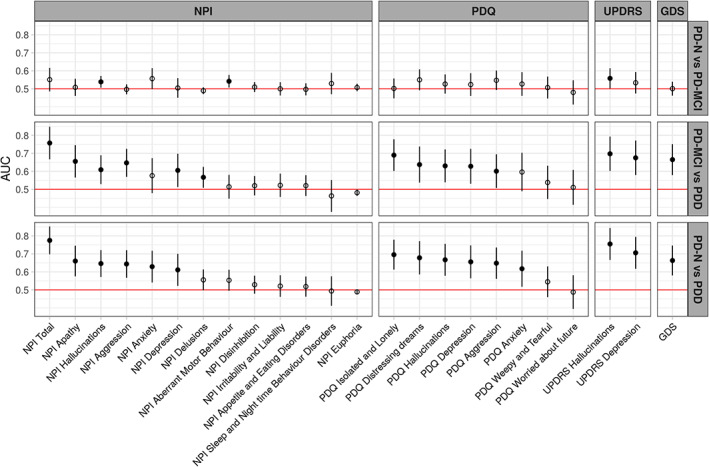
FIG. 2.

AUC values represent the probability of a classifier using individual behavioral symptom scores to rank a randomly chosen participant from one diagnostic group higher than a participant from another group. The dots represent the estimated AUC values, lines represent 95% CI. Filled dots indicate values significantly greater than 0.5 (chance performance). Items are from the NPI, PDQ, MDS‐UPDRS, and GDS scales. Items within each scale are sorted from right to left by the AUC value for classifying PDD from PD‐N.
