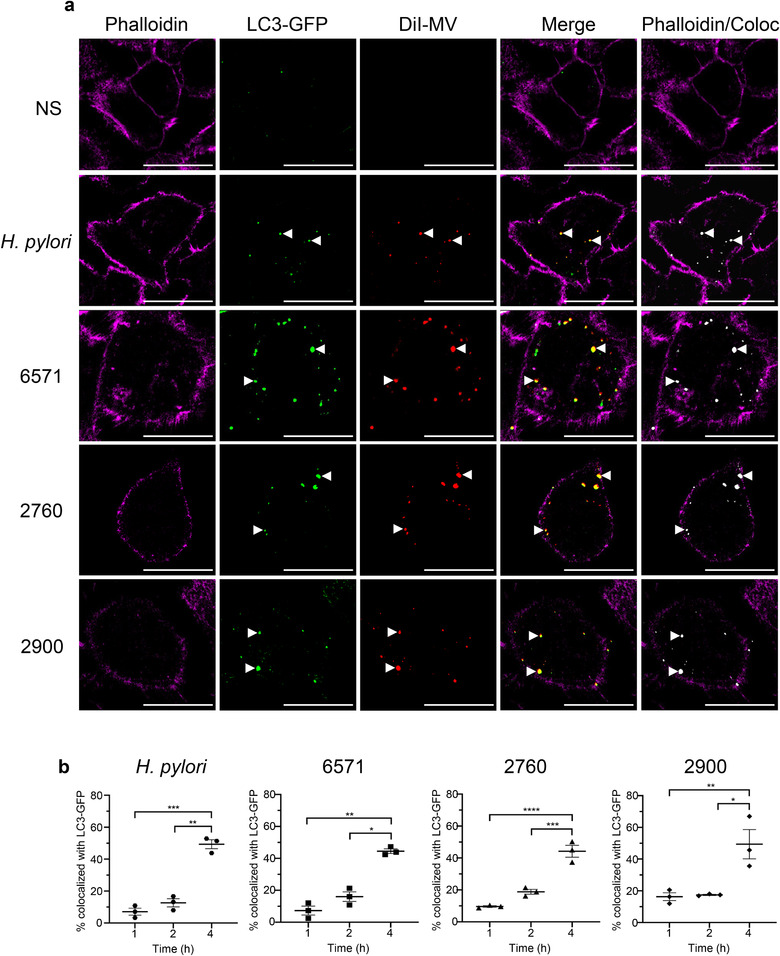
FIGURE 7.

MVs colocalize with LC3‐GFP puncta. (a) Single confocal plane of A549 cells stained with the cytoskeletal marker phalloidin Alexa Fluor 680 (magenta), showing intracellular LC3‐GFP puncta (green) and DiI‐labelled 6571, 2760 or 2900 MVs (red). Merged images show colocalization of LC3‐GFP puncta and MVs (yellow) within the cell cytoskeleton (magenta). Colocalization of LC3‐GFP with MVs was analyzed using Imaris (Bitplane) and detection of colocalized regions (coloc) is shown in white. Arrow heads indicate colocalized LC3‐GFP puncta with DiI‐labelled MVs or OMVs. Controls include H. pylori OMVs (red) or non‐stimulated cells. Images are representative of three biological replicates. Scale bar = 20 μm. (b) Percentage of colocalization between LC3‐GFP puncta and S. aureus MVs or H. pylori OMVs at 1 h, 2 h and 4 h stimulation. Data show three biological replicates with average ± SEM. Triplicate images were captured per treatment for each biological replicate, with >50 cells per biological replicate counted. *P < 0.05, **P < 0.01, ***P < 0.001, ****P < 0.0001 (One‐way ANOVA with Tukey's multiple comparisons test).
