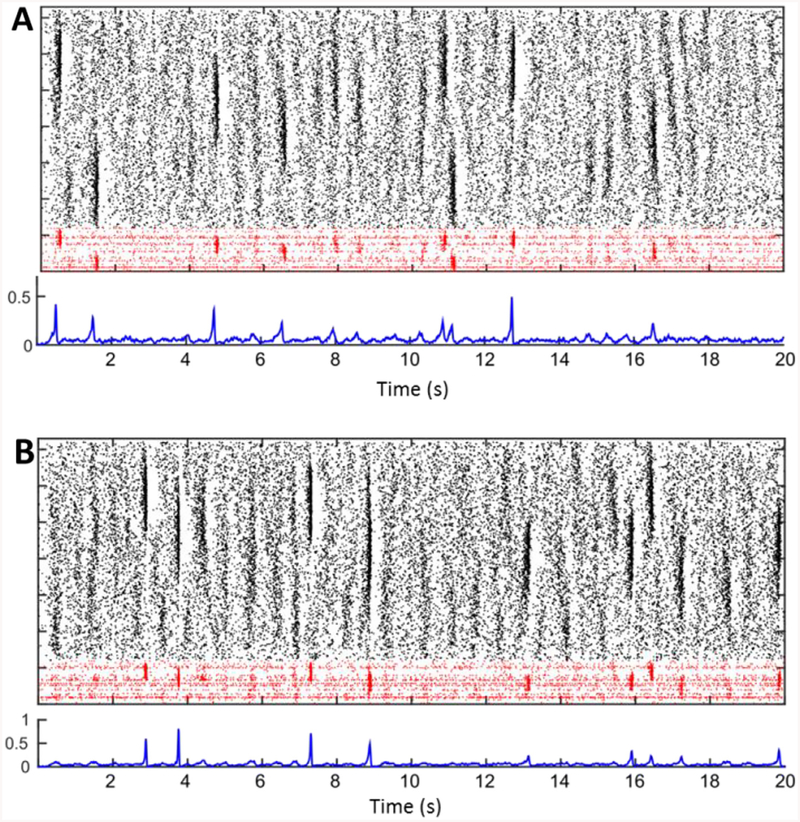
Fig. 2. Examples of CA3 network activity in the original model.
A. Top plot: spiking activity in one example simulation of CA3. The rastergram shows in black dots marking spikes of pyramidal cells, and in red interneurons. On the y-axis different cells are stacked by cell index, and on the x-axis time is in seconds. The line below shows the probability of spiking for CA3 pyramidal cells in windows of 30 ms. Note that high-spiking events appear as darker regions in the rastergram and as peaks of the spiking probability. The lower two plots represent a separate example of CA3 activity, generated by one new sample of connection matrix, heterogeneity DC values and ever-changing independent noise traces. Note that sharp-wave occurrence, size, and synchrony vary in time and across simulations. B. Same as A, but with a new instantiation of network connectivity, input noise and heterogeneity parameters. (For interpretation of the references to colour in this figure legend, the reader is referred to the web version of this article.)

