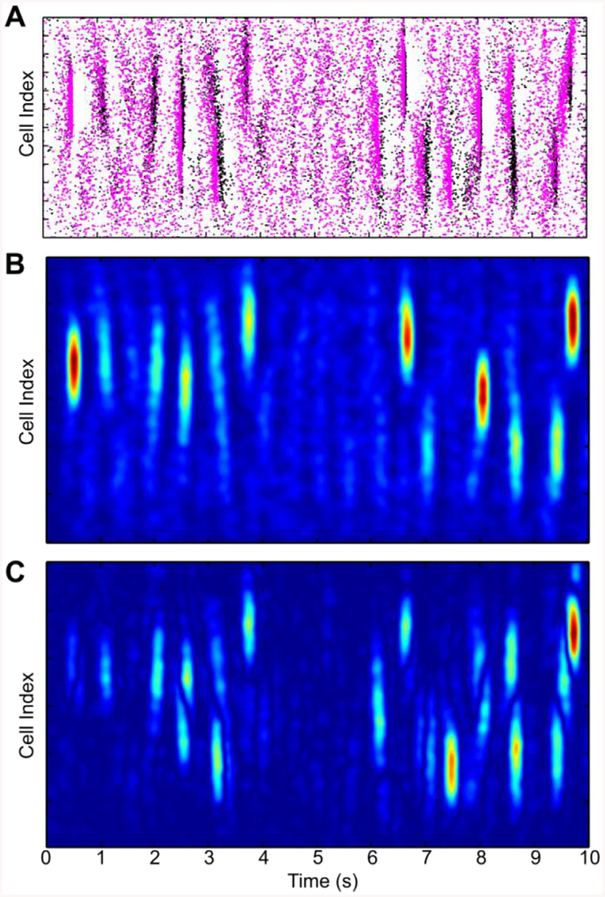
Fig. 3. Network activity is sensitive to initial conditions.
A. Rastergrams illustrating dynamics of PY cells spiking (black and red dots) generated by two identical networks in response to the same noisy inputs, but started at slighly different initial conditions. B. Smoothed activity field of the first network shown in A with black dots. C. Evolution of the deviations (errors) between network illustrated with the smoothed network fields demonstrate the increase of the perturbations in the network with time. (For interpretation of the references to colour in this figure legend, the reader is referred to the web version of this article.)

