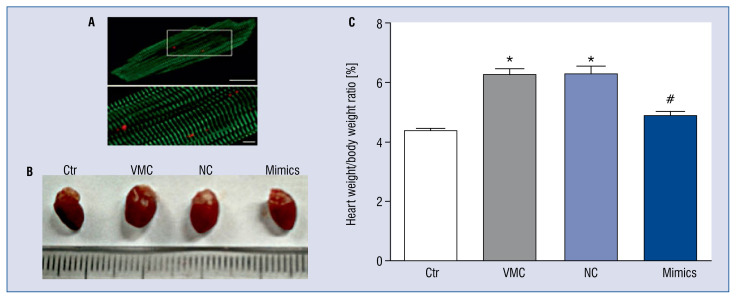
Figure 1.
Macroscopic view of hearts from different groups. A. Fluorescence showing specific staining of green (α-actinin) and red (Dy547) for miR-1/133; B. Global view of representative heart from each group; C. The statistical analysis of the heart weight/body weight ratio of mice in each group; Ctr — control group; VMC — viral myocarditis (VMC) group; NC — VMC + miR-1/133 negative control (NC) group; Mimics — VMC + miR-1/133 mimics (Mimics) group. Data are expressed as mean ± standard error (SE). N = 10, *p < 0.01 vs. control group, #p < 0.05 vs. VMC and VMC + NC group; for other abbreviations — see text.

